Thermodynamics - Solved Example Problems for Isobaric process | 11th Physics : UNIT 8 : Heat and Thermodynamics
Chapter: 11th Physics : UNIT 8 : Heat and Thermodynamics
Solved Example Problems for Isobaric process
EXAMPLE 8.19
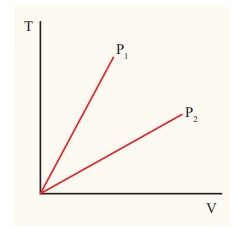
The following graph shows a V-T graph for isobaric processes at two different pressures. Identify which one occurs at higher pressure.
Solution
From the ideal gas equation,
V = (┬ĄR/P)T
V-T graph is a straight line passing the origin.
The slope = ┬ĄR/P
The slope of V-T graph is inversely proportional to the pressure. If the slope is greater, lower is the pressure.
Here P1 has larger slope than P2. So P2 > P1.
Suppose the graph is drawn between T and V (Temperature along the x-axis and Volume along the y-axis) then will we still have P2 > P1?
EXAMPLE 8.20
One mole of an ideal gas initially kept in a cylinder at pressure 1 MPa and temperature 27┬░C is made to expand until its volume is doubled.
(a)ŌĆé How much work is done if the expansion is (i) adiabatic (ii) isobaric (iii) isothermal?
(b) Identify the processes in which change in internal energy is least and is maximum.
(c) Show each process on a PV diagram.
(d) Name the processes in which the heat
(Take ╬│ = 5/3 and R=8.3 J mol-1 K-1)
Solution
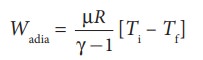
(a) (i) In an adiabatic process the work done by the system is
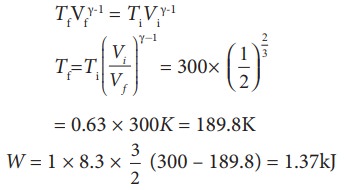
To find the final temperature Tf, we can use adiabatic equation of state.
(ii) In an isobaric process the work done by the system
W = P ŌłåV = P(Vf ŌĆō Vi)
and Vf = 2Vi so W = 2PVi
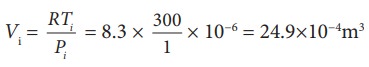
To find Vi, we can use the ideal gas law for initial state. PiVi = RTi
The work done during isobaric process,
W = 2 ├Ś 106 ├Ś 24.9 ├Ś 10ŌłÆ4 = 4.9 kJ
(iii) In an isothermal process the work done by the system,
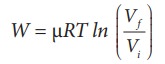
In an isothermal process the initial room temperature is constant.
W = 1 ├Ś 8.3 ├Ś 300 ├Ś ln(2) = 1.7kJ
(b) Comparing all three processes, we see that the work done in the isobaric process is the greatest, and work done in the adiabatic process is the least.
![]()
![]() (c) The PV diagram is shown in the Figure.
(c) The PV diagram is shown in the Figure.
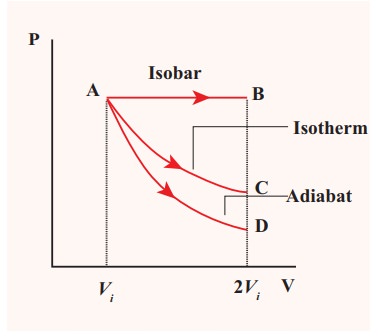
The area under the curve AB = Work done during the isobaric process
The area under the curve AC = Work done during the isothermal process
The area under the curve AD= Work done during the adiabatic process
From the PV diagram the area under the curve AB is more, implying that the work done in isobaric process is highest and work done in adiabatic process is least.
(d) In an adiabatic process no heat enters into the system or leaves from the system. In an isobaric process the work done is more so heat supplied should be more compared to an isothermal process.
Related Topics