Chapter: 11th Physics : UNIT 8 : Heat and Thermodynamics
Isothermal process
THERMODYNAMIC
PROCESSES
Isothermal
process
It is a process in which the temperature remains constant but the pressure and volume of a thermodynamic system will change. The ideal gas equation is
PV = ┬ĄRT
Here,
T is constant for this process
So
the equation of state for isothermal process is given by
PV =
constant

This
implies that if the gas goes from one equilibrium state (P1,V1)
to another equilibrium state (P2,V2) the following relation
holds for this process

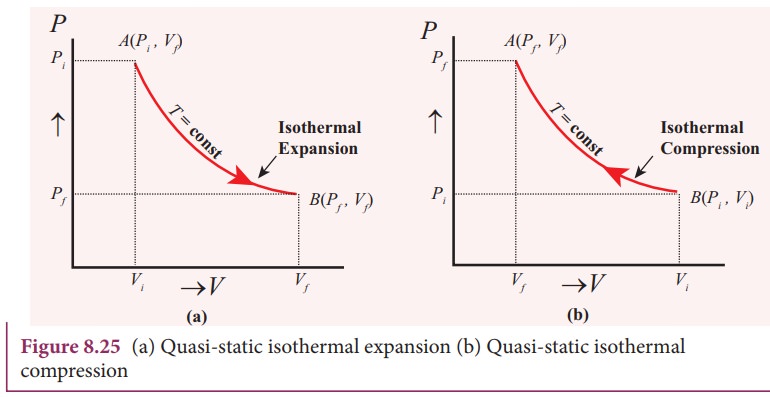
Since
PV = constant, P is inversely
proportional toV (P ŌłØ1/V ). This implies that PV graph is a hyperbola. The
pressure-volume graph for constant temperature is also called isotherm.
Figure
8.25 shows the PV diagram for quasi-static isothermal expansion and
quasi-static isothermal compression.
We know that for an ideal gas the internal energy is a function of temperature only. For an isothermal process since temperature is constant, the internal energy is also constant. This implies that dU or ŌłåU = 0.
For
an isothermal process, the first law of thermodynamics can be written as
follows,

From
equation (8.30), we infer that the heat supplied to a gas is used to do only
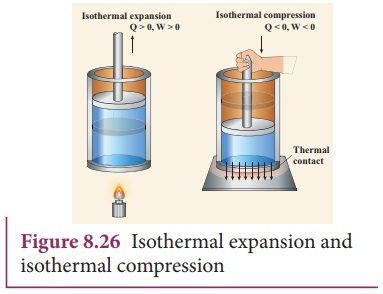
external work. It is a common misconception that when there is flow of heat to
the system, the temperature will increase. For isothermal process this is not
true. The isothermal compression takes place when the piston of the cylinder is
pushed. This will increase the internal energy which will flow out of the
system through thermal contact. This is shown in Figure 8.26.
Examples:
(i)
When water is heated, at the boiling point, even when heat flows to water, the
temperature will not increase unless the water completely evaporates.
Similarly, at the freezing point, when the ice melts to water, the temperature
of ice will not increase even when heat is supplied to ice.
(ii)
All biological processes occur at constant body temperature (37┬░C).
Work done in an isothermal process:
Consider
an ideal gas which is allowed to expand quasi-statically at constant
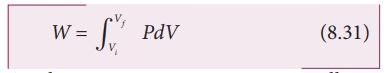
temperature from initial state (Pi,Vi) to the final state (PfŌĆå, Vf). We can calculate the work done by the gas during
this process. From equation (8.17) the work done by the gas,
As
the process occurs quasi-statically, at every stage the gas is at equilibrium
with the surroundings. Since it is in equilibrium at every stage the ideal gas
law is valid. Writing pressure in terms of volume and temperature,

Substituting
equation (8.32) in (8.31) we get
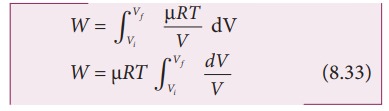
In
equation (8.33), we take ╬╝RT out of the integral, since it is constant
throughout the isothermal process.
By
performing the integration in equation (8.33), we get

Since
we have an isothermal expansion, Vf/Vi >1, so In(Vf/Vi) > 0. As a result the
work done by the gas during an isothermal expansion is positive.
The
above result in equation (8.34) is true for isothermal compression also. But in
an isothermal compression Vf/Vi < 1. so ln(Vf/Vi) <0.
As
a result the work done on the gas in an isothermal compression is negative.
In
the PV diagram the work done during the isothermal expansion is equal to the
area under the graph as shown in Figure 8.27
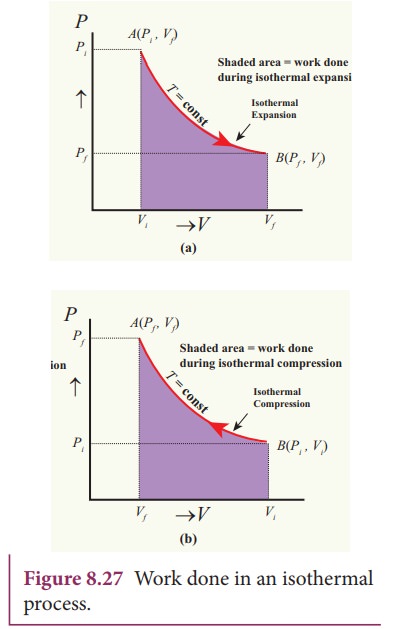
Similarly
for an isothermal compression, the area under the PV graph is equal to the work
done on the gas which turns out to be the area with a negative sign.
EXAMPLE 8.16
A
0.5 mole of gas at temperature 300 K expands isothermally from an initial
volume of 2 L to 6 L
(a)
What is the work done by the gas?
(b)
Estimate the heat added to the gas?
(c)
What is the final pressure of the gas? (The value of gas constant, R = 8.31 J
mol-1 K-1)
Solution
(a) We know that work done by the gas in
an isothermal expansion
Since
┬Ą = 0.5
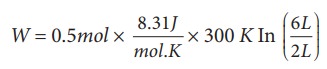
W = 1.369 kJ
Note
that W is positive since the work is done by the gas.
(b) From the First law of
thermodynamics, in an isothermal process the heat supplied is spent to do work.
Therefore,
Q = W = 1.369 kJ. Thus Q is
also positive which implies that heat flows in to the system.
(c) For an isothermal process
PiVi = PfVf = ┬ĄRT
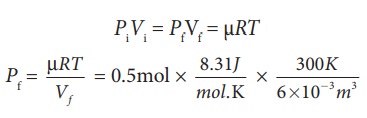
=207.75
k Pa
EXAMPLE 8.17
The
following PV curve shows two isothermal processes for two different
temperatures and. Identify the higher temperature of these two.
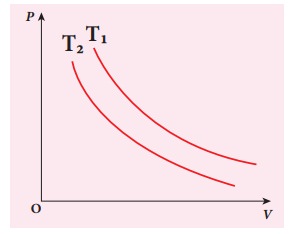
Solution
To
determine the curve corresponding to higher temperature, draw a horizontal line
parallel to x axis as shown in the figure. This is the constant pressure line.
The volumes V1 and V2 belong to same pressure as
the vertical lines from V1
and V2 meet the constant
pressure line.
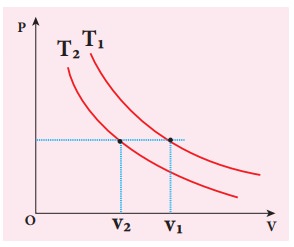
At
constant pressure, higher the volume of the gas, higher will be the
temperature. From the figure, as V1
> V2 we conclude T1 > T2. In
general the isothermal curve closer
to the origin, has lower temperature.
Related Topics