Chapter: 11th Physics : UNIT 11 : Waves
Graphical representation of the Progressive Wave (or) Travelling Wave
Graphical representation of the wave
Let us graphically represent the two forms of the wave variation
(a) Space (or Spatial) variation graph
(b) Time (or Temporal) variation graph
(a) Space variation graph

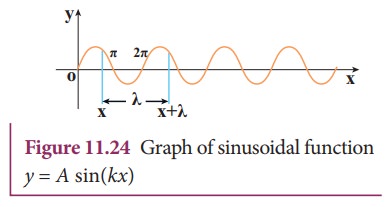
By keeping the time fixed, the change in displacement with respect to x is plotted. Let us consider a sinusoidal graph, y = A sin(kx) as shown in the Figure 11.24, where k is a constant. Since the wavelength λ denotes the distance between any two points in the same state of motion, the displacement y is the same at both the ends y = x and y = x + λ, i.e.,

The sine function is a periodic function with period 2π. Hence,

Comparing equation (11.38) and equation (11.39), we get
kx + k λ = kx + 2π
This implies

where k is called wave number. This measures how many wavelengths are present in 2π radians.
The spatial periodicity of the wave is
Then,
At t = 0 s y(x, 0) = y(x + λ, 0)
and
At any time t, y(x, t) = y(x + λ, t)
EXAMPLE 11.14
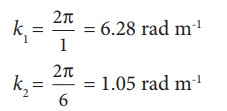
The wavelength of two sine waves are λ1 = 1m and λ2 = 6m. Calculate the corresponding wave numbers.
Solution

(b) Time variation graph

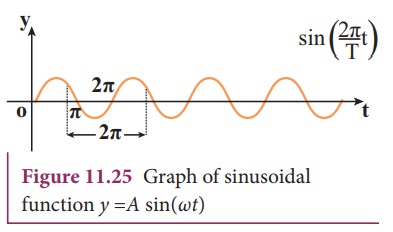
By keeping the position fixed, the change in displacement with respect to time is plotted. Let us consider a sinusoidal graph, y =A sin(ωt) as shown in the Figure 11.25, where ω is angular frequency of the wave which measures how quickly wave oscillates in time or number of cycles per second.
The temporal periodicity or time period is

The angular frequency is related to frequency f by the expression ω = 2 πf, where the frequency f is defined as the number of oscillations made by the medium particle per second. Since inverse of frequency is time period, we have,

This is the time taken by a medium particle to complete one oscillation. Hence, we can define the speed of a wave (wave speed, v) as the distance traversed by the wave per second

which is the same relation as we obtained in equation (11.4).
Related Topics