Chapter: Modern Analytical Chemistry: Electrochemical Methods of Analysis
Characterization Applications - Voltammetric Methods of Analysis
Characterization Applications
In the previous
section we saw how voltammetry can be used to determine the con- centration of an analyte.
Voltammetry also can be used to obtain additional infor- mation, including verifying
electrochemical reversibility, determining the
number of electrons transferred in a redox
reaction, and determining equilibrium constants
for coupled chemical reactions. Our discussion of these applications is limited
to the use of voltammetric techniques that give limiting currents, although other voltammetric techniques also can be used to obtain the
same information.
Electrochemical Reversibility and Determination of n
In
deriving a relationship between E1/2 and the standard-state potential for a redox couple
(11.41), we noted that the redox reaction must be reversible. How can we tell if a redox
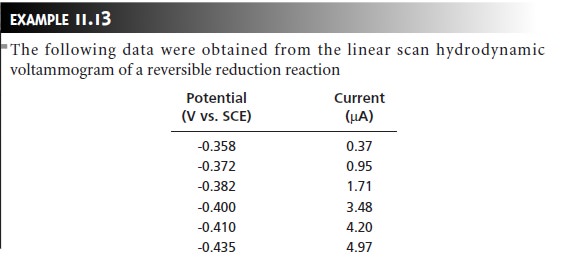
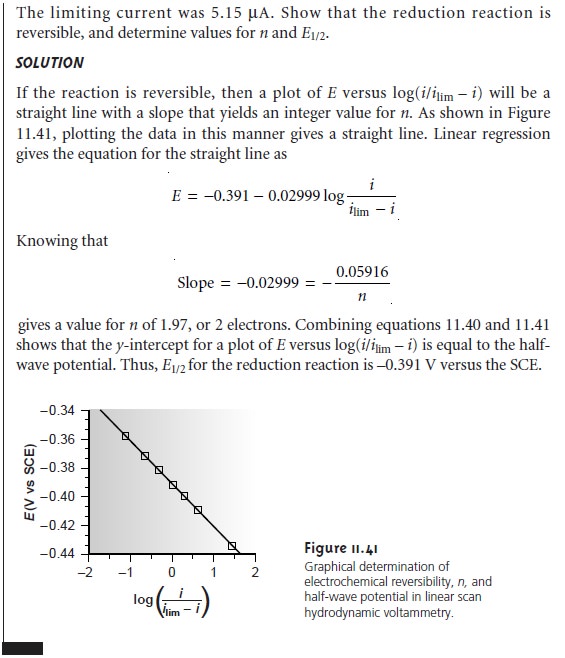
reaction is re- versible from its voltammogram? For a reversible reaction, equation 11.40
describes the voltammogram.

A plot of E versus log(i/ilim – i) for a reversible reaction, therefore, should be a
straight line with a slope of –0.05916/n. In addition,
the slope should yield an inte-
ger value for n.


Determining Equilibrium Constants for Coupled Chemical Reactions
An- other important application of voltammetry is the
determination of equilib- rium constants for solution reactions
that are coupled
to a redox reaction oc- curring at the electrode. The presence of the solution
reaction affects the ease
of electron transfer, shifting the potential to more negative
or more positive potentials. Consider, for example, the reduction of O to R
O+ ne– < = = = = > R
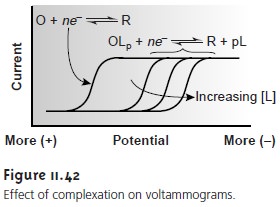
the voltammogram for which is shown in Figure 11.42.
If a ligand, L, capable of forming a strong
complex with O, is present, then the reaction
O + pL < = = = = > OLp
also must be considered. The overall reaction, therefore, is
OLp + ne– < = = = = > R+ pL

Because of its stability, reduction of the OLp complex is less favorable than the re- duction of O. As shown in Figure 11.42,
the voltammograms for
OLp occur at po- tentials more negative than those for O. Furthermore, the shift in the voltammo- gram depends on the ligand’s concentration.
The shift in the voltammogram for a metal
ion in the
presence of a ligand may be
used to determine both the metal–ligand complex’s
stoichiometry and its forma-
tion constant. To derive a relationship between
the relevant variables
we begin with two
equations: the Nernst
equation for the reduction of O

and the stability constant for the complex at the electrode
surface
 11.42
11.42
In the absence
of ligand the half-wave potential occurs when [R]x=0 and [O]x=0 are equal; thus, from the Nernst equation
we have
 11.43
11.43
where the subscript “nc” signifies that
no complex is present.
When ligand is present we must account for its effect on the
concentration of O. Solving
equation 11.42 for [O]x=0 and substituting into the Nernst
equation gives

If the ligand
is present in excess and the formation constant is sufficiently large, such that all
of O is present as the complex, then [R]x=0 and
[OLp]x=0 are
equal at the half-wave potential, and equation
11.44 simplifies to

where the subscript “c” indicates that the complex is present.
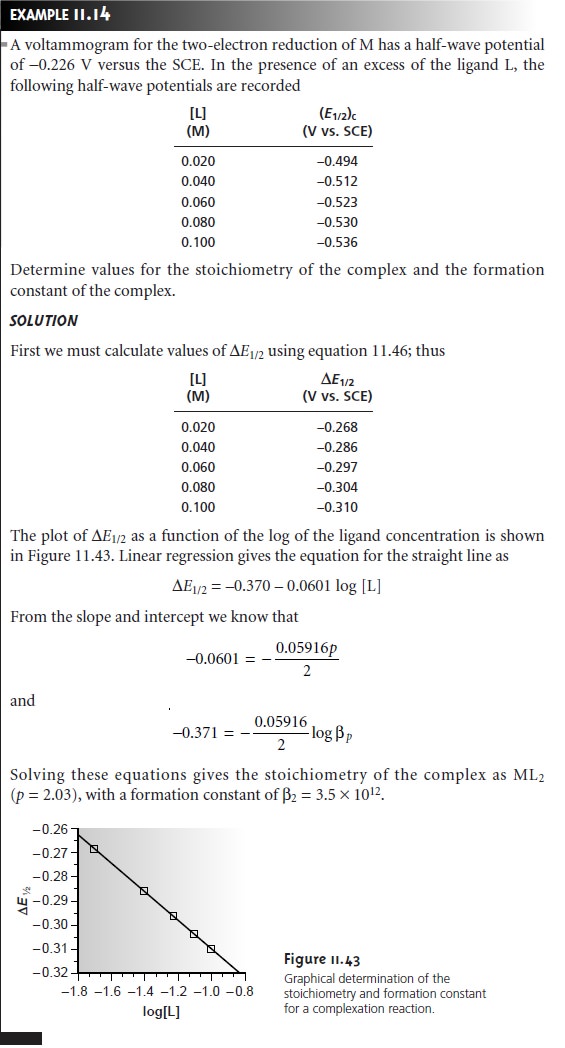
Defining ∆E1/2 as
∆E1/2 = (E1/2)c – (E1/2)nc ………..
11.46
and substituting equations 11.44 and 11.45 gives, after
rearranging

A plot of ∆E1/2 versus log [L],
therefore, gives a straight line.
The slope of the line
is used to determine the stoichiometric coefficient, p, and
the y-intercept gives the value for the formation constant βp

Related Topics