Atom Models | Physics - Atomic spectra | 12th Physics : UNIT 9 : Atomic and Nuclear Physics
Chapter: 12th Physics : UNIT 9 : Atomic and Nuclear Physics
Atomic spectra
Atomic
spectra
Materials in the solid, liquid and gaseous states emit electromagnetic
radiations when they are heated up and these emitted radiations usually belong
to continuous spectrum. For example, when white light is examined through a spectrometer,
electromagnetic radiations of all wavelengths are observed which is a
continuous spectrum.
In early twentieth century, many scientists spent considerable
time in understanding the characteristic radiations emitted by the atoms of
individual elements exposed to a flame or electrical discharge.
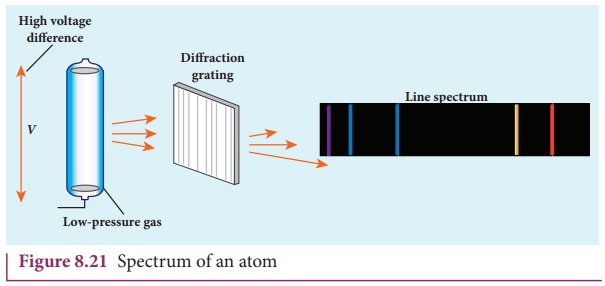
When they are viewed or photographed, instead of a continuous
spectrum, the radiation contains of a set of discrete lines, each with
characteristic wavelength. In other words, the wavelengths of the light
obtained are well defined and the positions and intensities are characteristic
of the element as shown in Figure 8.21.
This implies that these spectra are unique to each element and
can be used to identify the element of the gas (like finger print used to
identify a person) – that is, it varies from one gas to another gas. This
uniqueness of line spectra of elements made the scientists to determine the
composition of stars, sun and also used to identify the unknown compounds.
Hydrogen spectrum
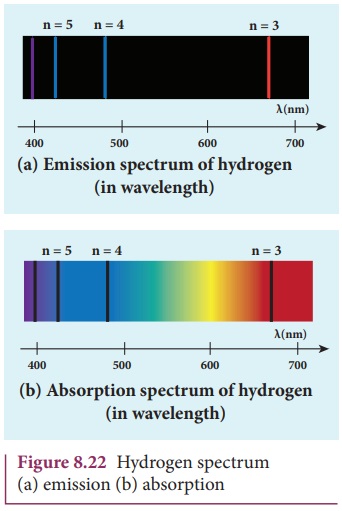
When the hydrogen gas enclosed in a tube is heated up, it emits
electromagnetic radiations of certain sharply-defined characteristic wavelength
(line spectrum), called hydrogen emission spectrum (Refer unit 5, volume 1 of
+2 physics text book). The emission spectra of hydrogen are shown in Figure
8.22(a).
When any gas is heated up, the thermal energy is supplied to
excite the electrons. Similarly by passing light on the atoms, electrons can be
excited by absorbing photons. Once the electrons get sufficient energy as given
by Bohr’s postulate (c), it absorbs energy with particular wavelength (or
frequency) and jumps from its stationary state (original state) to higher
energy state. Those wavelengths (or frequencies) for which the colours are not
observed are seen as dark lines in the absorption spectrum as shown in Figure
8.22 (b).
Since electrons in excited states have very small life time,
these electrons jump back to ground state through spontaneous emission in a
short duration of time (approximately 10–8 s) by emitting the
radiation with same wavelength (or frequency) corresponding to the colours it
absorbed (Figure 8.22 (a)). This is called emission spectroscopy.
The wavelengths of these lines can be calculated with great
precision. Further, the emitted radiation contains wavelengths both lesser and
greater than the visible spectrum.
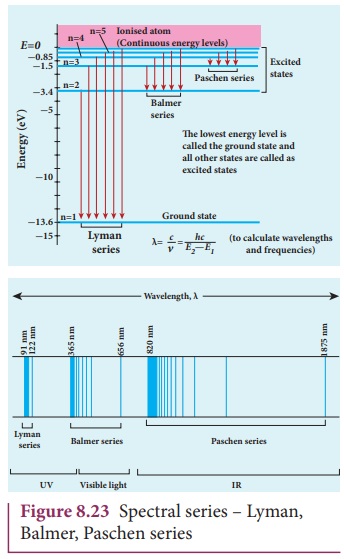
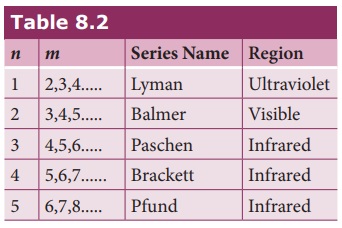
Notice that the spectral lines of hydrogen as shown in Figure
8.23 are grouped in separate series. In each series, the distance of separation
between the consecutive wavelengths decreases from higher wavelength to the
lower wavelength, and also wavelength in each series approach a limiting value
known as the series limit. These series are named as Lyman series, Balmer
series, Paschen series, Brackett series, Pfund series, etc. The wavelengths of
these spectral lines perfectly agree with the equation derived from Bohr atom
model.
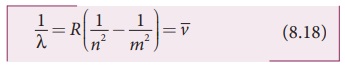
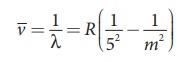
where ![]() is
known as wave number which is inverse of wavelength, R is known as Rydberg constant whose value is 1.09737 x 10⁷
m-1 and m and n are positive integers such that m > n. The various spectral series
are discussed below:
is
known as wave number which is inverse of wavelength, R is known as Rydberg constant whose value is 1.09737 x 10⁷
m-1 and m and n are positive integers such that m > n. The various spectral series
are discussed below:
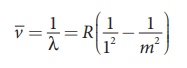
(a) Lyman series
Put n = 1 and m = 2,3,4. in
equation (8.18). The wave number or wavelength of spectral lines of Lyman
series which lies in ultra-violet region is
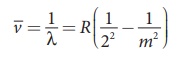
(b) Balmer series
Put n = 2 and m = 3,4,5. in equation (8.18). The wave
number or wavelength of spectral lines of Balmer series which lies in visible
region is
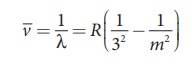
(c) Paschen series
Put n = 3 and m = 4,5,6. in
equation (8.18). The wave number or wavelength of spectral lines of Paschen
series which lies in infra-red region (near IR) is
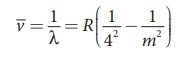
(d) Brackett series
Put n = 4 and m = 5,6,7. in equation (8.18). The wave
number or wavelength of spectral lines of Brackett series which lies in
infra-red region (middle IR) is
(e) Pfund series
Put n = 5 and m = 6,7,8. in
equation (8.18). The wave number or wavelength of spectral lines of Pfund
series which lies in infra-red region (far IR) is
Different spectral series are listed in Table 8.2.
Limitations of Bohr atom model
The following are the drawbacks of
Bohr atom model
(a) Bohr atom model
is valid only for hydrogen atom or hydrogen like-atoms but not for complex
atoms.
(b) When the
spectral lines are closely examined, individual lines of hydrogen spectrum is
accompanied by a number of faint lines. These are often called fine structure. This is not explained
by Bohr atom model.
(c) Bohr atom model fails to explain the intensity variations in
the spectral lines.
(d) The distribution of electrons in atoms is not completely
explained by Bohr atom model.
Related Topics