Algebra | Chapter 3 | 8th Maths - Linear Graph | 8th Maths : Chapter 3 : Algebra
Chapter: 8th Maths : Chapter 3 : Algebra
Linear Graph
Linear
Graph
1. Linear
pattern
Plot the
following points on a coordinateplane:(0,2),(1,3),(2,4),(3,5), (4, 6).What do you find? They all lie on a line! There is some pattern
in them.
Look at the
y- coordinate in each ordered pair: 2 = 0+2; 3 = 1+2; 4 = 2+2; 5 = 3+2; 6 = 4+2 In each pair, the y- coordinate is 2 more than the x- coordinate. The coordinates of each point have the same relationship between them. All the points plotted lie on a line!
In such a
case, when all the points plotted lie on a line, we
say ‘a
linear pattern’ exists.
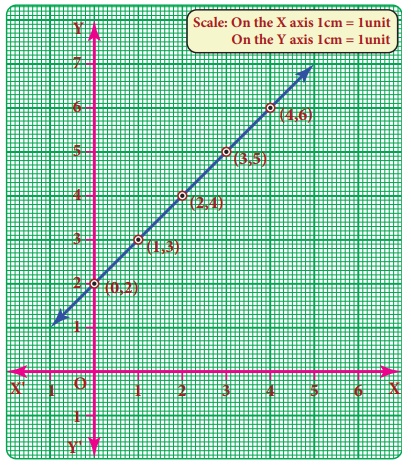
In this example,
we found that in each ordered pair y value
= x value +2.
Therefore the linear pattern above can be denoted by the algebraic equation y = x + 2. Such an equation is called a linear equation and the line graph for linear equation is called a linear graph.
Linear equations
use one (or more) variables where one variable is dependent on the other(s).
The longer
the distance we travel by a taxi, the more we have to pay. The distance travelled
is an example of an independent variable. Being dependent on the distance,
the taxi fare is called the dependent variable.
The more
one uses electricity, greater will be the amount of electricity bill. The amount
of electricity consumed is an example for independent variable and the bill amount
is naturally the dependent variable.
2. Graph
of a linear function in two variables
We have talked about parallel lines, intersecting lines etc., in geometry but never actually looked at how far apart they were, or where they were .Drawing graphs helps us place lines. A linear equation is an equation with two variables (like x and y) whose graph is a line. To graph a linear equation, we need to have at least two points, but it is usually safe to use more than two points. (Why?) When choosing points, it would be nice to include both positive and negative values as well as zero. There is a unique line passing through any pair of points.
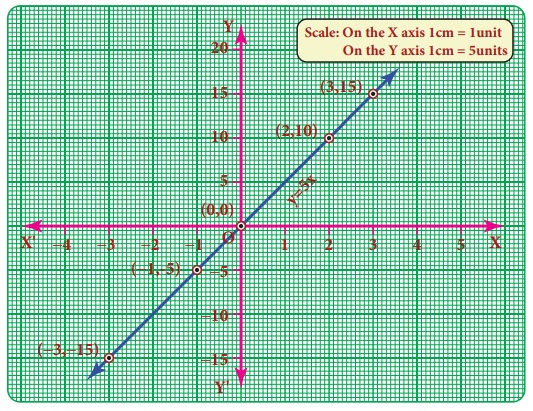
Example 3.44
Draw the
graph of y = 5 x
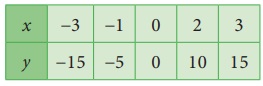
Solution:
The given
equation y = 5 x means that for any value of x,
y takes five times of x value.

Plot the
point (−3,−15) (−1,−5) (0,0) (2,10) (3,15)
Example 3.45
Graph the equation y = x
+ 1.
Begin by
choosing a couple of values for x and
y. It will firstly help to see
(i) what
happens to y when x is zero and
(ii) what
happens to x when y is zero.
After this
we can go on to find one or two more values.
Let us find
at least two more ordered pairs. For easy graphing, let us avoid fractional answers.
We shall
make suitable guesses.
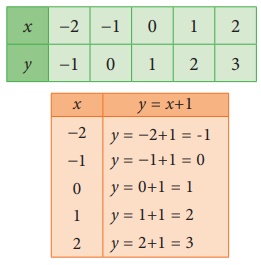

We have now
five points of the graph: (−2,−1)
(−1, 0) (0, 1) (1, 2) and (2, 3).
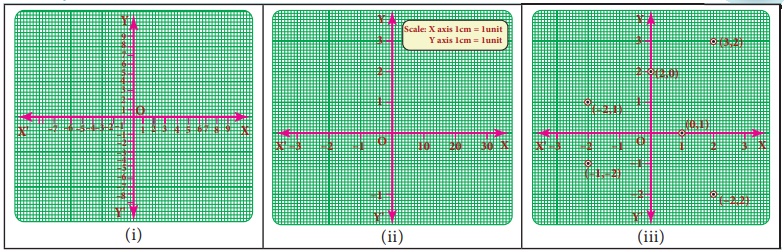
Note
The orientation of the graph will be different according to the scale
chosen.
Try these
Identify and correct the errors
Solution: