Algebra | Chapter 3 | 8th Maths - Graph | 8th Maths : Chapter 3 : Algebra
Chapter: 8th Maths : Chapter 3 : Algebra
Graph
Graph
1. Introduction
There was
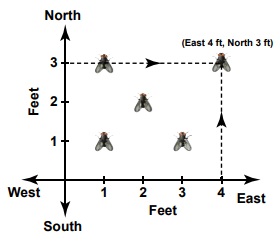
an instance in the 17th century when Rene Descartes, a famous mathematician became ill and from his bed,
noticed an insect hovering over a corner and sitting at various places on the ceiling.
He wanted to identify all the places where the insect sat on the ceiling. Immediately,
he drew the top plane of the room in a paper, creating the horizontal and vertical
lines. Based on these perpendicular lines, he used the directions and understood
that the places of the insect can be spotted by the movement of the insect in the
east, west, north and south directions. He called that place as (x,y)
in the plane which indicates two values, one (x) in the horizontal direction and the other (y) in the vertical direction (say east and north in this case). This
is how the concept of graphs came into existence.
2. Graph
sheets
Graph is
just a visual method for showing relationships between numbers. In the previous
class, we studied how to represent integers on a number line horizontally. Now take
one more number line – vertically. We take the graph sheet keeping both number lines
mutually perpendicular to each other at ‘0’zero as given in the figure. The number
lines and the marking integers should be placed along the dark lines of the graph
sheet.
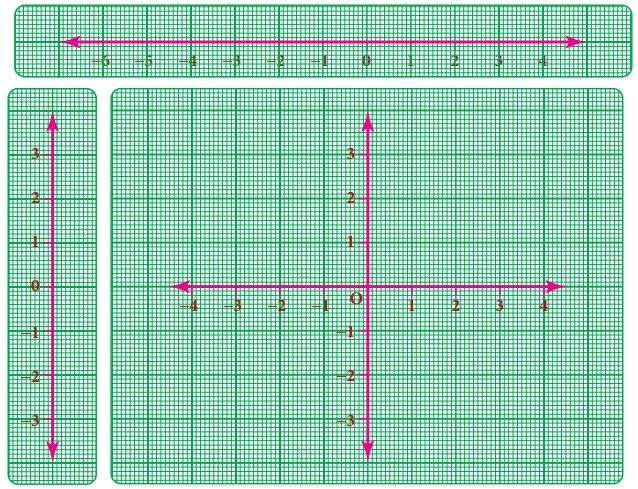
The intersecting point of the perpendicular lines ‘O’ represent the
origin (0, 0).
Cartesian
system
Rene Descartes
system of fixing a point with the help of two measurements, horizontal and vertical,
is named as Cartesian system, in his
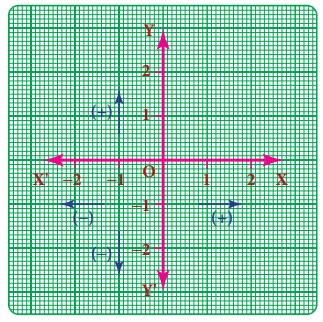
honour. The horizontal line is named as XOX', called the X-axis. The
vertical line is named as YOY', called the Y- axis. Both the axes are called coordinate axes. The plane containing the
X axis and the Y axis is known as the coordinate plane or the Cartesian plane.
3. Signs
in the graphs
1. X-coordinate
of a point is positive along OX and negative along OX'
2. Y-coordinate
of a point is positive along OY and negative along OY'
4. Ordered
pairs
A point represents
a position in a plane. A point is denoted by a pair (a,b) of two numbers ‘a’ and
‘b’ listed in a specific order in which ‘a’ represents the distance along the X-axis
and ‘b’ represents the distance along the Y-axis. It is called an ordered pair (a,b). It helps us to locate precisely a point
in the plane. Each point can be exactly identified by a pair of numbers.
It is also clear that the point (b,a) is not same as (a,b) as they both indicate
different orders.
We have,
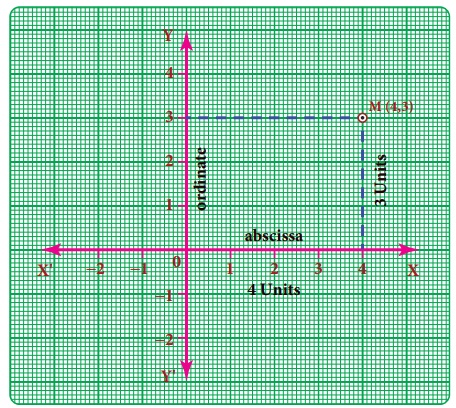
XOX' and YOY' as the co-ordinate axes and let ‘M’ be (4,3) in the plane.To locate
‘M’
(i) you (always)
start at O, a fixed point (which we have,
agreed to call as origin),
(ii) first, move 4 units along the horizontal
direction (that is, the direction of x-axis)
(iii) and then trek along the y- direction by 3 units.
To understand
how we have travelled to reach M, we denote by (4,3).
4 is called
the x-coordinate of M and 3 is called
the y-coordinate of M. It is also habitual
to name the x-coordinate
as abscissa and the y-coordinate as ordinate. (4,3) is as an ordered pair.
Think
If instead of (4,3), we write (3,4) and try to mark it, will it represent
‘M’ again?
Solution:
Let 3, 4 be M, when we mark, we find that it is a
different point and not ‘M’
5. Quadrants
The coordinate
axes divide the plane of the graph into four regions called quadrants. It is a convention
that the quadrants are named in the anti clock wise sense starting from the positive
side of the X axis.
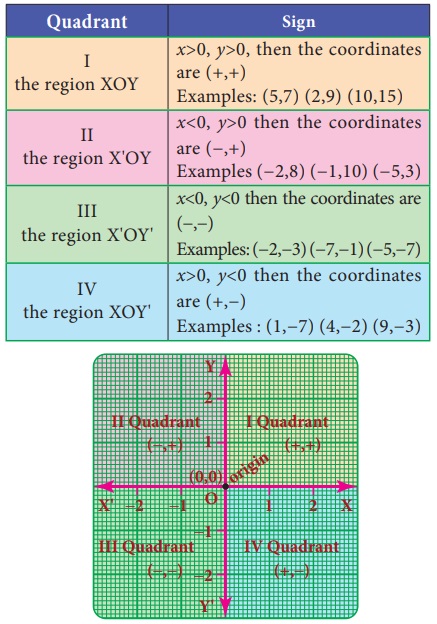
Quadrant : Sign:
Quadrant : I the region XOY : Sign: x>0, y>0, then the coordinates
are (+,+) Examples: (5,7) (2,9)
(10,15)
Quadrant : II the region X'OY : Sign: x<0, y>0 then the coordinates are (−,+) Examples (−2,8) (−1,10) (−5,3)
Quadrant : III the region X'OY' : Sign: x<0, y<0 then the
coordinates are (−,−) Examples:
(−2,−3) (−7,−1) (−5,−7)
Quadrant : IV the region XOY' : Sign: x>0, y<0 then the coordinates are (+,−) Examples : (1,−7) (4,−2) (9,−3)
Coordinate of a point on
the axes:
•If y=0 then
the coordinate (x, 0) lies on the ‘x’-axis.
For example
(2, 0) (−5, 0) (7,0) are points on the ‘x’-axis.
•If x=0 then the coordinate (0,y) lies on the
‘y’-axis.
For example
(0, 3) (0,−4) (0, 9) are points on the ‘y’-axis.
6. Plotting
the given points on a graph
Consider the following
points (4,3), (−4,5), (−3,−6), (5,−2), (6,0), (0,−5)
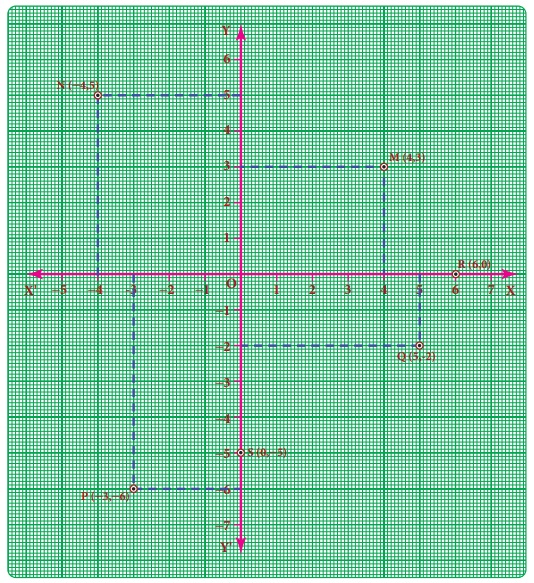
(i) To locate (4,3).
Start from
origin O, move 4 units along OX and from 4, move 3 units parallel to OY to reach
M(4,3).
(ii) To locate (−4,5)
From the
origin, move 4 units along OX' and from −4, move 5 units parallel to OY to reach
N(−4,5).
(iii) To locate (-3, -6)
From the
origin move 3units along OX' and from −3, move 6 units parallel to OY' to reach
P(-3,-6).
(iv) To locate (5,−2)
From the
origin move 5 points along OX and from 5, move 2 units parallel to OY' to reach
Q(5,−2).
(v) To locate (6,0) and (0, 5)
In the given
point (6, 0), X-coordinate is 6 and Y-coordinate is zero. So the point lies on the
x-axis. Move 6 units on OX from the origin
to reach R(6, 0).
In the given
point (0,−5) X-coordinate is zero and Y- coordinate is (−5). So, the point lies
on Y-axis. Move 5 units on OY' from the origin to reach S (0,−5).
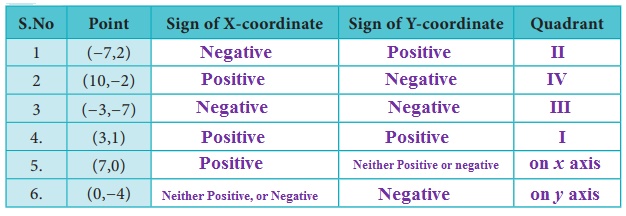
Try these
1. Complete the table given
below.
2. Write the coordinates
of the points marked in the following figure
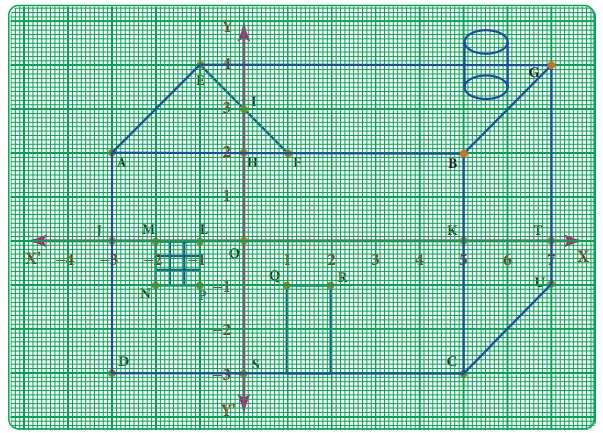
Solution:
A- (−3, 2) B - (5, 2) C- (5, −3) D - (−3, 3) E - (−l, 4)
F- (l, 2) G - (7, 4) H - (0, 2) I - (0, 3) J - (−3, 0)
K-(5, 0) L - (−l, 0) M - (−2, 0) N- (−2, −1) O - (0, 0)
P - (−1, −1) Q - (1, −1)
R - (2, −l) S - (0, −3) T- (7, 0)
U - (7, −2)