Chapter: Psychology: Sensation
Vision Contrast Effects
Contrast
Effects
Earlier, we discussed the fact
that our sensory systems are keenly sensi-tive to differences—and so a noise sounds louder if it occurs in an
otherwise quiet room; a room feels particularly warm if you’ve just come in
from the cold. Similar effects can easily be documented for vision.
Notice, though, that these
examples all involve changes as time goes by—so that the stimulus now is different from the one you
experienced a moment ago. It turns out that the visual system is also sensitive
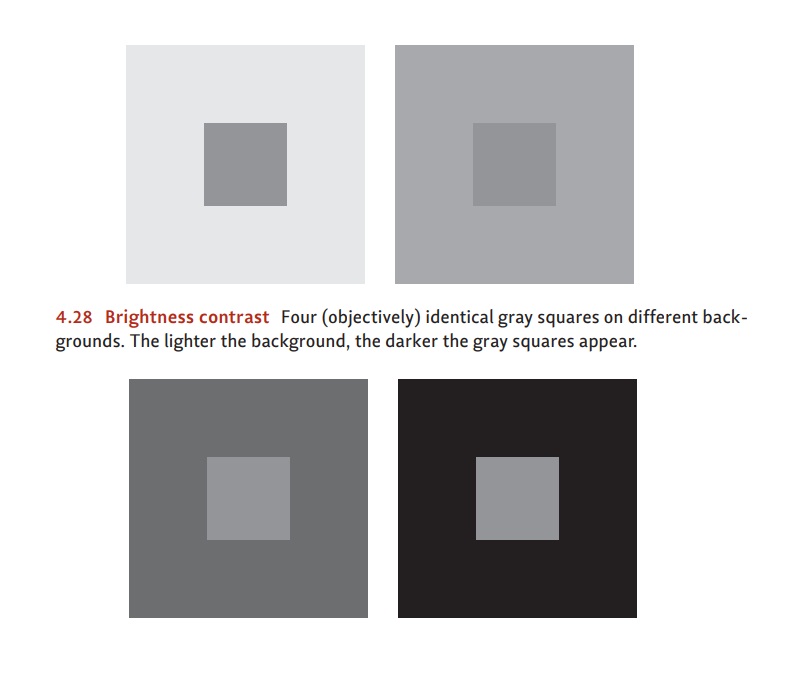
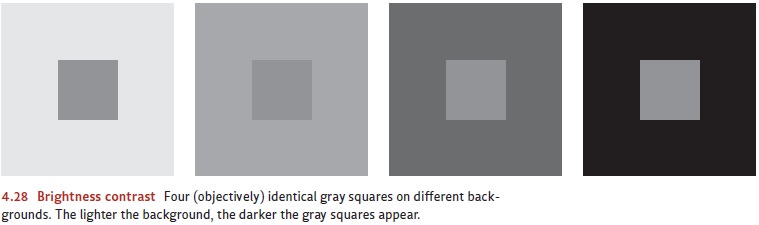
to spatial contrast—the differences between the stimulus in view here and the one in view there. This is evident, for example, in brightness contrast—the effect that
makes a stimulus look much brighter on a dark background than on a bright one
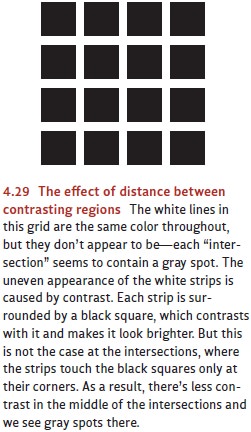
(Figure 4.28). Brightness contrast can be documented in many settings, and so
it plays a role in creating some illusions (Figure 4.29) as well as certain
artistic effects.
Contrast effects have an
extremely important consequence: They make it easier for us to identify the
objects we encounter. This point grows out of the fact that the objects we see
are usually viewed against backgrounds that are at a different brightness level
than the target object; hence, a change in brightness—from darker to lighter,
or vice versa— typically marks a visual boundary, a point where one object
stops and another begins. And, of course, these boundaries are immensely
important for the visual system because they define the object’s shape—and shape, in turn, is the
information we generally use to identify an object.
Perhaps it’s not surprising,
then, that the visual system does more than just detect brightness boundaries.
It actually amplifies them by a
process often called edge enhance-ment which
relies on brightness contrast and allows us to see the edges between
objectsmore clearly. This exaggeration of edges happens with virtually all
stimuli, but it’s
particularly obvious in the
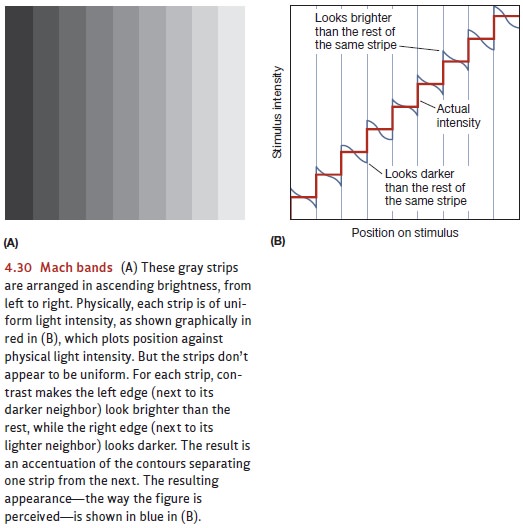
illusion we call mach bands (Figure
4.30A). In this figure, each separate strip of gray is uniform in its
brightness. That is, the figure shows a homoge-nous dark strip, then a uniform
slightly lighter strip, then another uniform slightly lighter strip, and so on.
However, most people don’t perceive the strips as uniform. Instead, they
perceive each strip as being slightly darker along its right-hand edge, where
it meets its brighter neighbor. They also perceive each strip as slightly
brighter along its left-hand edge, where it meets its darker neighbor. The
resulting pattern is summarized in Figure 4.30B.
This illusion is produced by contrast
effects like those we’ve already described. Specifically, when a light region
borders a dark region, contrast between the two makes the light region look
even lighter and makes the dark region look darker still. By accen-tuating the
difference between the two adjacent regions, the contrast highlights the edge
where the two regions meet.
We can take our explanation of
this effect one step further because we can specify the events in the nervous
system that lead to brightness contrast. The key is lateralinhibition—a pattern of interaction among neurons in which
activity in one neuronactually decreases the responses in adjacent neurons.
This is, in other words, inhibi-tion exerted sideways. We can document this
effect at many levels of the visual sys-tem; for example, recordings from
single cells in the retina confirm that activity in one cell actually causes
the immediately adjacent cells to fire less
than they otherwise would.
To see how this pattern of
interaction leads to edge enhancement, consider two cells, each receiving
stimulation from a brightly lit area (Figure 4.31). One cell (Cell B in the
figure) is receiving its stimulation from the middle of the lit area. It is
strongly stimu-lated, but so are all of its neighbors, creating a situation in which
all of the cells in this area are inhibiting each other. As a result, Cell B’s
activity level is increased by the
stim-ulation but also decreased by
the lateral inhibition it’s receiving from nearby cells— including (in the
figure) Cells A and C. This combination leads to only a moderate level of
activity overall in this cell—and so the signal Cell B sends to the brain is
weaker than it would have been without the inhibition.
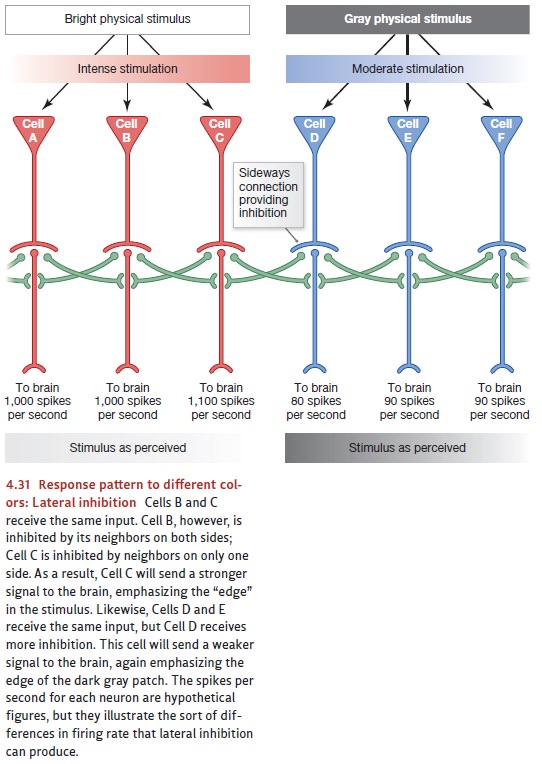
In contrast, another cell (Cell C
in the figure) is receiving its stimulation from the edge of the lit area. Cell
C is therefore strongly stimulated, and so are its neighbors onone side. As a result, this cell is
receiving inhibition from one side (by Cell B) but notfrom the other (Cell D),
so it will be less inhibited than Cell B (which is receiving inhi-bition from
all sides).
What’s the result of all this interaction? Cells B and C initially receive the same input, but C is less inhibited than B, so it ends up firing more strongly than B and thus sending a stronger signal to the brain than B does. Of course, the same is true for all of the other cells (like Cell C) that receive their input from the edge of a surface, and for all cells (like B) that receive their input from the middle of the surface. The result is that all the cells detecting the edge of a bright surface end up producing a stronger response than that of the cells detecting the middle of the surface. This pat-tern will then lead to an exaggerated response along the surface’s edges, making these edges easier to detect.
The reverse happens for cells
being stimulated by a patch that’s not as bright. Cells D and E both receive
the same (weak) input. Cell E, though, is surrounded by cells that are only
mildly activated, so it receives only gentle inhibition from its neighbors.
Cell D, in contrast, has at least one very excited neighbor (Cell C), so it
receives a large dose of inhibition. As a result, Cells D and E both receive
the same input, but Cell D (because of the inhibition it receives) ends up
firing less strongly than Cell E. Again, this leads to an exaggeration of the
edge; and the weakest signal is coming from the cell at the edge of the dark
patch.
These interactions among cells indicate exactly how the visual system enhances the brightness of boundaries it encounters—and, with that, why Mach bands appear as they do. Besides that, these mechanisms illustrate another important point. Earily, we asked whether we can think of the sensory mechanisms as passive recorders of the stimulus input or as mechanisms that somehow organize and interpret the input. The answer to these questions should be clear by now—and will become clearer as our discussion continues. Thanks to lateral inhibition, the visual system seems to be refining the stimulus information from the very start, emphasizing some aspects of the input (the edges) and understating other aspects (the areas being uniformly stimulated).
Lateral inhibition arises from
mechanisms just a synapse or two into the visual system; but even at this early
level, the nervous system is “cleaning up” the input and doing far more than
merely “receiving and recording” the incoming stimulus.
Related Topics