Chapter: Psychology: Sensation
Hearing
HEARING
Our survey so far has
deliberately held two senses to the side—namely, hearing and vision. This is
because humans rely on these two senses more than any of the oth-ers,
justifying more extensive coverage of how we hear and how we see. Without
question these are the two sense modalities that we use for the vast majority
of our communication, and that provide our main guidance as we move around.
Let’s therefore examine how these two essential modalities function, starting
with our sense of hearing.
The Stimulus: Sound
What is the stimulus for hearing?
Outside in the world, some physical object is moving—perhaps an animal
scurrying through the underbrush, or a set of vocal cords vibrating. This
movement agitates the air particles that surround the moving object, causing
these particles to jostle other particles, which in turn jostle still other
particles. The actual movement of these particles is slight (about one-billionth
of a centimeter) and short-lived; the particles return to their original
position in a few thousandths of a second. But the motion is enough to create a
momentary pressure that pushes outward from the moving object in a pattern
similar to the ripples that are set in motion by a stone thrown into a pond.
If the movement continues for
even a short time, it will create a series of pressure vari-ations in the air.
When these sound waves hit our ears,
they initiate a set of further changes that ultimately trigger the auditory
receptors. The receptors in turn trigger neu-ral responses, which eventually
reach the brain and lead to the experience of hearing.
Sound waves vary in many ways;
but, in the simplest case, they take the form shown in Figure 4.16. This is,
for example, the pattern that would result if a tuning fork were
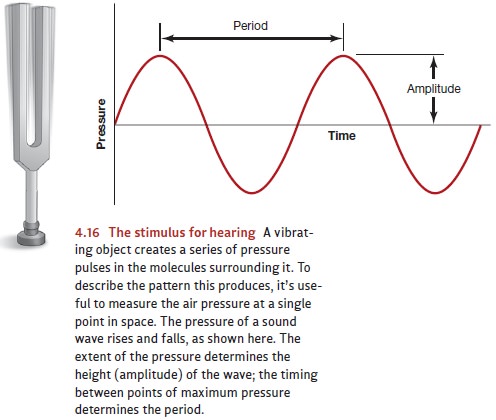
vibrating back and forth, pushing
on the air molecules next to it each time the vibration moves the fork in one
direction, and then pulling back on the same air molecules a moment later when
the vibration moves the fork in the other direction. That’s why the pressure
rises and falls as time goes by, in correspondence to the pushes and pulls the
tuning fork is creating. (A vibrating guitar string or a vibrating clarinet
reed have roughly the same effect, although these instruments produce a more
complex pattern than the one shown in the figure; other movements—like the
sound of a voice—would produce still more complex patterns.)
The pattern shown in Figure 4.16
is produced by a physical vibration and corre-sponds exactly to the plot of the
trigonometric sine function, so this wave can be accu-rately labeled a sine wave. To describe the wave more
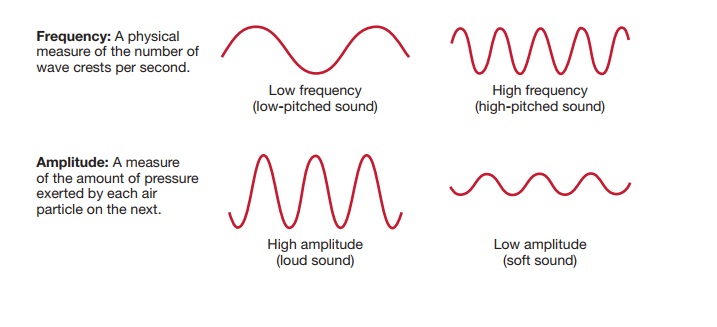
precisely, we need to specify two things. First is the amplitude—the amount of pressure exerted by each air particle on
the next. As the figure shows, this pressure is constantly changing as the air
molecules vibrate toward each other, then away, then toward again. Thus, the
amplitude we actu-ally measure is the maximum
pressure achieved at the crest of the sound wave. Second, we need to specify
how widely spaced these pressure crests are. We could do this in terms of wavelength—a measurement of the distance
between one crest and the next— or in terms of period, a measure of how much time elapses between one crest and
the next. When measuring sounds, it’s usually more convenient to take the
inverse of the period; so, instead of measuring seconds per crest, we measure
crests per second, which is the frequency
of the wave. This means our measure is literally a count of how many times in
each second the wave reaches its maximum amplitude (Figure 4.17).
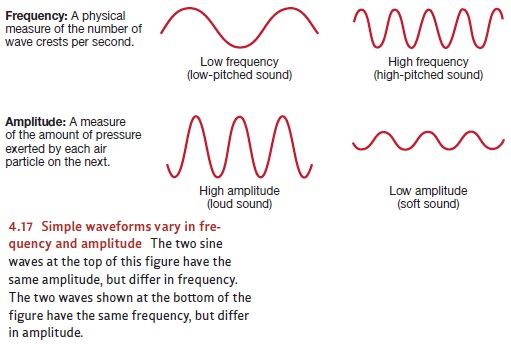
Amplitude and frequency are physical
dimensions of the sound wave itself, but they cor-respond reasonably well to
the psychological dimensions of loudness and pitch. Roughly speaking, a sound
will be heard as louder as its amplitude increases. It turns out that humans
can respond to an enormous range of amplitudes, so investigators find it useful
to measure these intensities with a logarithmic scale, which compresses the
range into a more convenient form. Specifically, sound intensities are measured
in decibels, and they’re always
assessed in relation to some standard. A standard of zero decibels is often
assumed to be the average detection threshold for an adult with normal hearing.
Loudness doubles each time the intensity of a sound increases by 10 decibels
(Stevens, 1955).
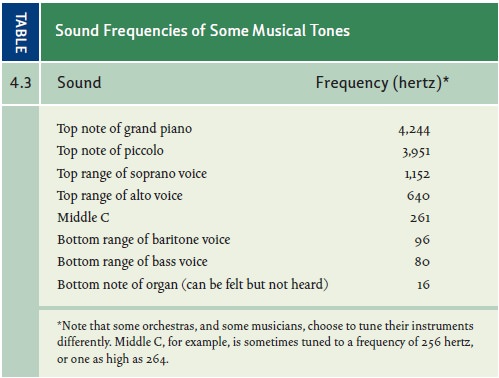
The frequency of a sound wave is
measured in cycles per second, or hertz
(named after the 19th-century physicist Heinrich Hertz). As frequency
increases, the subjective pitch of the sound goes up. Middle C on a piano
generally has a frequency of 261 hertz; the C an octave higher has a frequency
of 522 hertz. (In general, a doubling of frequency produces the experienced
pitch difference of one octave.) The frequencies associated with other musical
tones are shown in Table 4.3. Young adults can hear tones as low as 20 hertz
and as high as 20,000 hertz. As people get older, their sensitivity to sound
declines— especially at the higher frequencies. For this reason, sometimes
there’s little point for a
30- or 40-year-old to buy
expensive stereo equipment, since what makes the equipment expensive is often
its exquisite ability to reproduce high frequencies accurately! In many cases,
the middle-aged stereo buyer will be deaf to these frequencies and so probably
won’t be able to tell the difference between the expensive stereo and a cheaper
one.
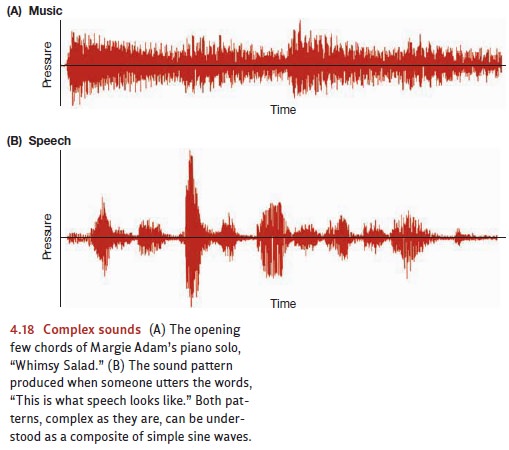
So far, we’ve been talking only
about sine waves; but we rarely encounter sine waves in our everyday lives.
Instead, the sound waves we usually experience are far more complex. Figure
4.18A, for example, shows the moment-by-moment changes in air pressure produced
by a few seconds of music; Figure 4.18B shows the moment-by-moment pressure
changes produced by a bit of ordinary speech.
The mathematician Joseph Fourier
was able to show that these complex waves are actually just the sum of simpler
components—in particular, the sum of a series of sine waves. Essentially, we
can think of sine waves as the “ingredients” that combine to pro-duce more
complicated sounds. The “recipe” for creating the more complex sound must
identify which ingredients are to
be used (i.e., which frequencies) and how much of each ingredient is needed
(i.e., how much amplitude for each of the frequencies is mixed into the whole).
But once that’s done, we can use the recipe to create any sound we choose from
sine-wave ingredients. Psychologists as well as physicists, audio engi-neers,
and many others routinely use Fourier analysis to describe in detail the sounds
we encounter in our day-to-day experience.
From Sound Waves to Hearing
So far, our discussion has
described only the physics of sound waves—the stimulus for hearing. What does
our ear, and then our brain, do with this stimulus to produce the sensation of
hearing?
GATHERING THE SOUND WAVES
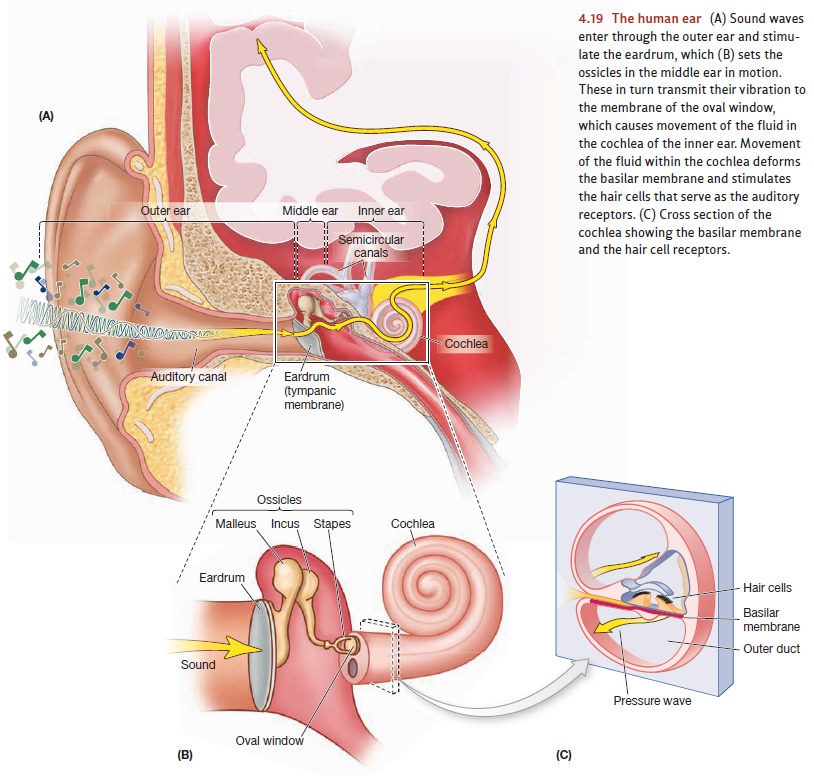
Mammals have their receptors for
hearing deep within the ear, in a snail-shaped struc-ture called the cochlea. To reach the cochlea, sounds
must travel a complicated path (Figure 4.19). The outer ear collects the sound waves from the air and directs them
toward the eardrum, a taut membrane
at the end of the auditory canal. The
sound waves make the eardrum vibrate, and these vibrations are then transmitted
to the oval win-dow, the membrane
that separates themiddle earfrom theinner ear. This transmissionis
accomplished by a trio of tiny bones called the auditory ossicles—the smallest bones in the human body. The
vibrations of the eardrum move the first ossicle (the malleus), which then
moves the second (the incus), which in turn moves the third (the stapes). The
stapes completes the chain by sending the vibration pattern on to the oval
window, which the stapes is attached to. (The ossicles are sometimes referred
to by the English translations of their names—the hammer, the anvil, and
the stirrup, all references to the
bones’ shapes.) The movements of the oval window then give rise to waves in the
fluid that fills the cochlea, causing (at last) a response by the receptors.
Why do we have this roundabout
method of sound transmission? The answer lies in the fact that these various
components work together to create an entirely mechanical— but very
high-fidelity—amplifier. The need for amplification arises because the sound
waves reach us through the air, and the proximal stimulus for hearing is made
up of minute changes in the air pressure. As we just mentioned, though, the
inner ear is (like most body parts) filled with fluid. Therefore, in order for
us to hear, the changes in air pressure must cause changes in fluid
pressure—and this is a problem, because fluid is harder to set in motion than
air is.
To solve this problem, the
pressure waves have to be amplified as they move toward the receptors; this is
accomplished by various features of the ear’s organization. For example, the
outer ear itself is shaped like a “sound scoop” so it can funnel the pressure
waves toward the auditory canal. Within the middle ear, the ossicles use
mechanical leverage to increase the sound pressure. Finally, the eardrum is
about 20 times larger than the portion of the oval window that’s moved by the
ossicles. As a result, the fairly weak force provided by sound waves acting on
the entire eardrum is transformed into a much stronger pressure concentrated on
the (smaller) oval window.
TRANSDUCTION IN THE COCHLEA
For most of its length, the cochlea is divided into an upper and lower section by several structures, including the basilar membrane. The actual auditory receptors—the 15,000 hair cells in each ear—are lodged between the basilar membrane and other membranes above it (Figure 4.19c).
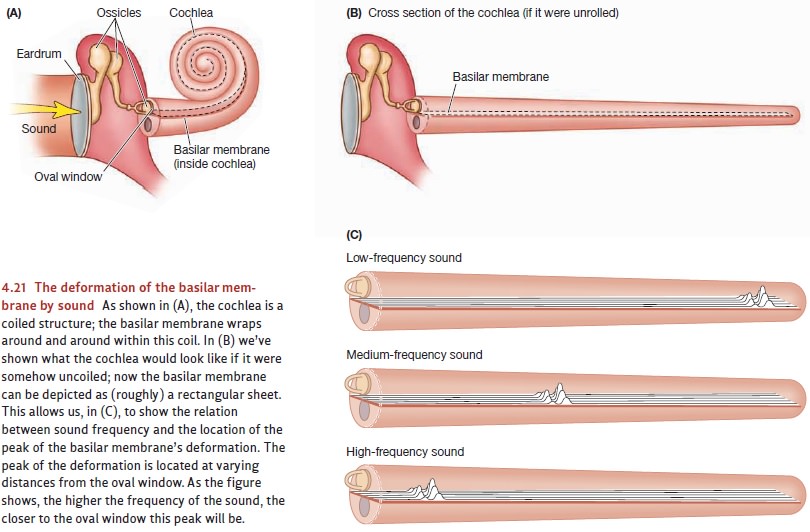
Motion of the oval window produces pressure changes in the cochlear fluid that, in turn, lead to vibrations of the basilar membrane. As the basilar membrane vibrates, its deformations bend the hair cells; this bending causes ion channels in the membranes of these cells to open, triggering the neural response. Sound waves arriv-ing at the ear generally cause the entire basilar membrane to vibrate, but the vibra-tion is not uniform. Some regions of the membrane actually move more than others, and the frequency of the incoming sound determines where the motion is greatest. For higher frequencies, the region of greatest movement is at the end of the basilar membrane closer to the oval window; for lower frequencies, the greatest movement occurs closer to the cochlear tip.
More than a century ago, these
points led Hermann von Helmholtz (Figure 4.20) to propose the place theory of pitch perception. This
theory asserts that the nervous sys-tem is able to identify a sound’s pitch
simply by keeping track of where the movement is greatest along the length of
the basilar membrane. More specifically, stimulation of hair cells at one end
of the membrane leads to the experience of a high tone, while stim-ulation of
hair cells at the other end leads to the sensation of a low tone (Figure 4.21).
There’s a problem with this theory, though. As the frequency of the stimulus gets lower and lower, the pattern of movement it produces on the basilar membrane gets broader and broader. At frequencies below 50 hertz, the movement produced by a sound stimulus deforms the entire membrane just about equally. Therefore, if we were using the location of the basilar membrane’s maximum movement as our cue to a sound’s frequency, we’d be unable to tell apart any of these low frequencies. But that’s not what happens; humans, in fact, can discriminate frequencies as low as 20 hertz. Apparently, then, the nervous system has another way of sensing pitch besides basilar location.
This other means of sensing pitch
is tied to the firing rate of cells in the auditory nerve. For lower-pitched
sounds, the firing of these cells is synchronized with the peaks of the
incoming sound waves. Consequently, the rate of firing, measured in neural
impulses per second, ends up matched to the frequency of the wave, measured in
crests per second. This coding, based on the exact timing of the cells’ firing,
is then relayed to higher neural centers that interpret this information as
pitch.
Note, then, that the ear has two
ways to encode pitch: based on the location of max-imum movement on the basilar
membrane, and based on the firing rate of cells in the auditory nerve. For
higher-pitched sounds, the location-based mechanism plays a larger role; for
lower-pitched sounds, the frequency of firing is more important (Goldstein,
1999).
FURTHERPROCESSINGOFAUDITORYIN FORMATION
Neurons carry the auditory
signals from the cochlea to the midbrain. From there, the signals travel to the
geniculate nucleus in the thalamus, an important subcortical structure in the
forebrain . Other neurons then carry the signal to the primary projection areas
for hearing, in the cortex of the temporal lobe. These neurons and those that
follow have a lot of work to do: The auditory signal must be analyzed for its timbre—the sound quality that helps us
distinguish a clarinet from an oboe, or one person’s voice from another’s. The
signal must also be tracked across time, to evaluate the patterns of pitch
change that define a melody or to distinguish an assertion (“I can have it”)
from a question (“I can have it?”). The nervous system must also do the
analysis that allows us to identify the sounds we hear—so we know that we heard
our cell phone and not someone else’s, or so we can recognize the words someone
is speaking to us. Finally, the nervous system draws one other type of
information from the sound signal: Pretty accurately, we can tell where a sound
is coming from—whether from the left or the right, for example. This localization is made possible by several
cues, including a close comparison of the left ear’s signal and the right
ear’s, as well as by tracking how the arrival at the two ears changes when we
turn our head slightly to the left or right.
Let’s keep our focus, though, on
how we can detect a sound’s pitch. It turns out that each neuron along the
auditory pathway responds to a wide range of pitches, but even so, each has a
“preferred” pitch—a frequency of
sound to which that neuron fires more vigorously than it fires to any other
frequency. As in the other senses, this pattern of responding makes it
impossible to interpret the activity of any individual neuron: If, for example,
the neuron is firing at a moderate rate, this might mean the neuron is
responding to a soft presentation of its preferred pitch, or it might mean the
neuron is responding to a louder version of a less preferred pitch.
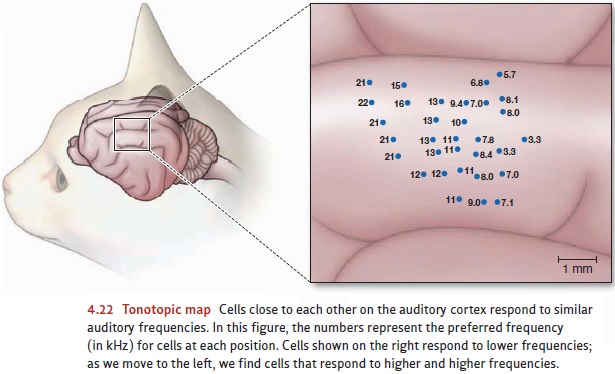
To resolve this ambiguity, the
nervous system must compare the activity in each of these neurons to the level
of activity in other neurons, to determine the overall pattern. So the
detection of pitch, just like most of the other senses, relies on a “pattern
code.” This process of comparison may be made easier by the fact that neurons
with similar preferred pitches tend to be located close to each other on the
cortex. This arrangement creates what’s known as a tonotopic map—a map organized on the basis of tone. For example,
Figure 4.22 shows the results of a careful mapping of the audi-tory cortex of
the cat. There’s an obvious ordering of preferred frequencies as we move across
the surface of this brain area.
Related Topics