Example Solved Problem | Mathematics - Quadratic Graphs | 10th Mathematics : UNIT 3 : Algebra
Chapter: 10th Mathematics : UNIT 3 : Algebra
Quadratic Graphs
Quadratic Graphs
Introduction
The trajectory followed by an object (say, a ball) thrown upward
at an angle gives a curve known as a parabola. Trajectory of water jets in a
fountain or of a bouncing ball results in a parabolic path. A parabola
represents a Quadratic
function.

A quadratic function has
the form f (x) = ax2
+ bx + c, where a, b, c are constants, and a ≠ 0.
Many quadratic functions can be graphed easily by hand using the
techniques of stretching/shrinking and shifting the parabola y = x2
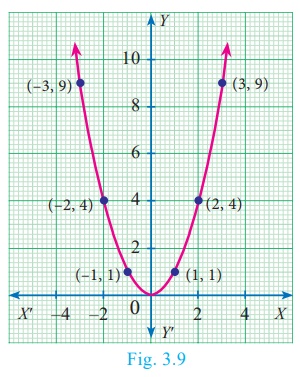
(We can easily sketch the curve y = x2 by preparing a
table of values and plotting the ordered pairs).
The “basic” parabola, y = x2, looks like this
Fig.3.9.
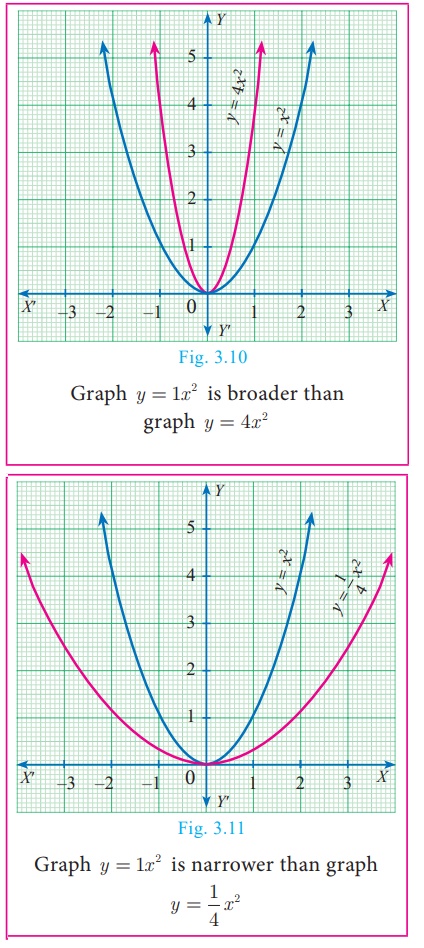
The coefficient a in the general equation is responsible for
parabolas to open upward or downward and vary in “width” (“wider” or
“skinnier”), but they all have the same basic “ U ” shape.
The greater the quadratic coefficient, the narrower is the
parabola.
The lesser the quadratic coefficient, the wider is the parabola.
A parabola is symmetric with respect to a line called the axis of
symmetry. The point of intersection of the parabola and the axis of symmetry is called the vertex of the parabola. The
graph of any second degree polynomial gives a curve called “parabola”.

We have already studied how to find the roots of any quadratic
equation ax2 + bx + c = 0 where
a,b,c ∈ ℝ and a ≠ 0 theoretically. In this section, we
will learn how to solve a quadratic equation and obtain its roots
graphically.
1. Finding the Nature of Solution of Quadratic Equations Graphically
To obtain the roots of the quadratic equation ax2
+ bx +c = 0 graphically, we first draw the graph
of y = ax 2 +bx +c .
The solutions of the quadratic equation are the x
coordinates of the points of intersection of the curve with X axis.
To determine the nature of solutions of a quadratic equation, we
can use the following procedure.
(i) If the graph of the given quadratic equation intersect the X
axis at two distinct points, then the given equation has two real and unequal
roots.
(ii) If the graph of the given quadratic equation touch the X
axis at only one point, then the given equation has only one root which is same
as saying two
real and equal roots.
(iii) If the graph of the given equation does not intersect the X
axis at any point then the given equation has no real root.
Example 3.48
Discuss the nature of solutions of the following quadratic
equations.
(i) x2 + x −12 = 0
(ii) x2 − 8x + 16 = 0
(iii) x2 + 2x + 5 = 0
Solution
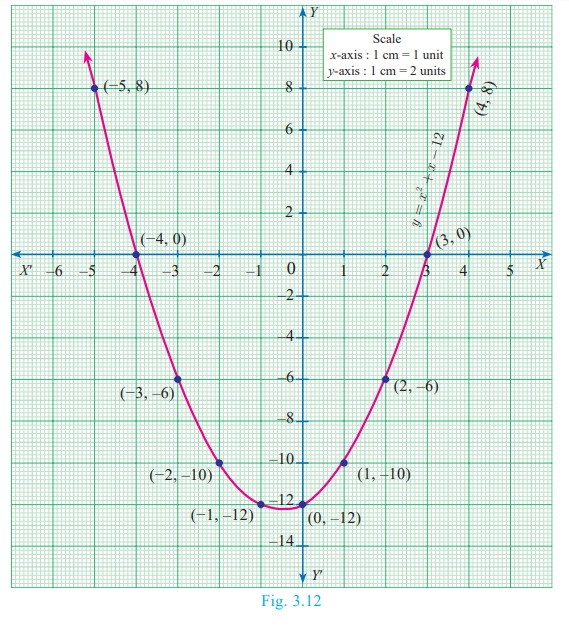
(i) x2
+ x −12 = 0
Step 1
Prepare the table of values for the equation y = x2
+ x −12 .

Step 2
Plot the points for the above ordered pairs (x, y) on the
graph using suitable scale.
Step 3
Draw the parabola and mark the co-ordinates of the parabola which
intersect the X axis.
Step 4
The roots of the equation are the x coordinates of the
intersecting points (–4, 0) and (3,0)of the parabola with the X axis which are
−4 and 3 respectively.
Since there are two points of intersection with the X axis, the
quadratic equation x2 + x −12 = 0
has real and unequal roots.
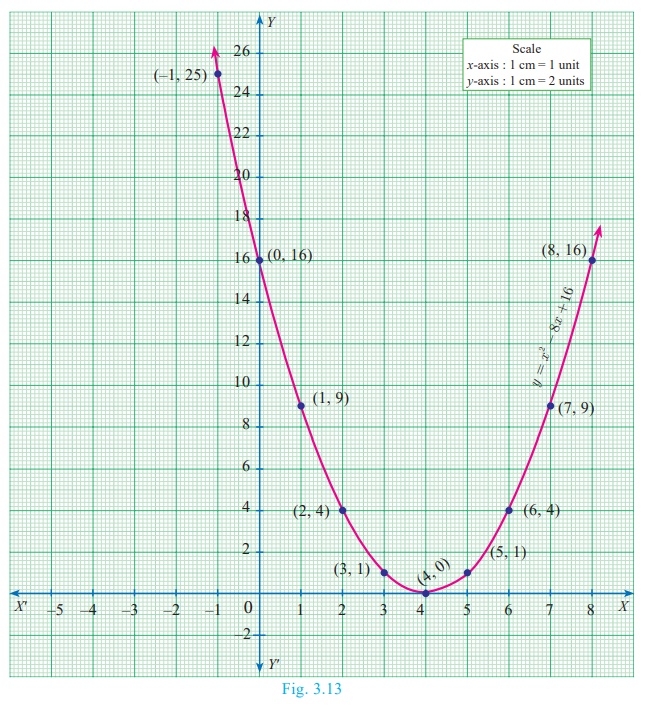
(ii) x2
− 8x + 16 = 0
Step 1
Prepare the table of values for the equation y = x2
− 8x + 16

Step 2
Plot the points for the above ordered pairs (x, y) on the
graph using suitable scale.
Step 3
Draw the parabola and mark the coordinates of the parabola which
intersect with the X axis.
Step 4
The roots of the equation are the x coordinates of the
intersecting points of the parabola with the X axis (4,0) which is 4.
Since there is only one point of intersection with X axis,
the quadratic equation x2 − 8x + 16
= 0 has real and equal roots.
(iii) x2
+ 2x + 5 = 0
Let y = x2 + 2x +
5
Step 1
Prepare a table of values for the equation y = x 2
+ 2x + 5

Step 2
Plot the above ordered pairs(x, y) on the graph using
suitable scale.
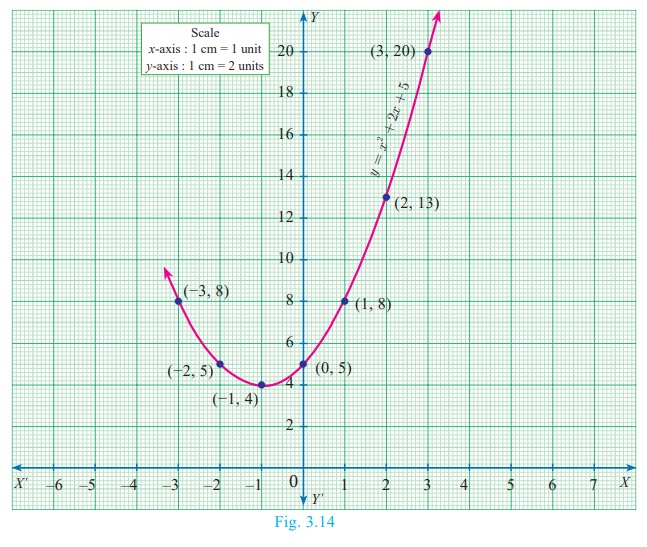
Step 3
Join the points by a free-hand smooth curve this smooth curve is
the graph of y = x2
+ 2x + 5
Step 4
The solutions of the given quadratic equation are the x
coordinates of the intersecting points of the parabola the X axis.
Here the parabola doesn’t intersect or touch the X axis.
So, we conclude that there is no real root for the given quadratic equation.
2. Solving quadratic equations through intersection of lines
We can determine roots of a quadratic equation graphically by
choosing appropriate parabola and intersecting it with a desired straight line.
(i) If the straight line intersects the parabola at two distinct points, then the x coordinates
of those points will be the roots of the given quadratic equation.
(ii) If the straight line just touch the parabola at only one point, then the x
coordinate of the common point will be the single root of the quadratic equation.
(iii) If the straight line doesn’t intersect or touch the parabola then the quadratic
equation will have no real roots.
Example 3.49
Draw the graph of y = 2x2 and hence solve 2x2 − x − 6 = 0
Solution
Step 1
Draw the graph of y=2x2 by preparing the table of
values as below

Step 2
To solve 2x2 − x − 6 = 0 , subtract 2x2
− x − 6 = 0 from y = 2x 2

The equation y = x + 6
represents a straight line. Draw the
graph of y = x+6 by forming table of values as below

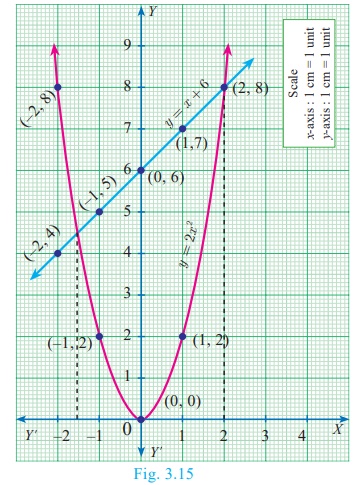
Step 3
Mark the points of intersection of the curve y = 2x
2 and the line
y = x +
6 . That is, (–1.5, 4.5) and (2,8)
Step 4
The x coordinates of the respective points forms the solution set {–1.5,2} for 2x 2 − x − 6 = 0
Example 3.50
Draw the graph of y = x2 + 4x
+ 3 and hence find the roots of x2 + x + 1
= 0
Solution
Step 1
Draw the graph of y = x2 + 4x + 3
by preparing the table of values as below
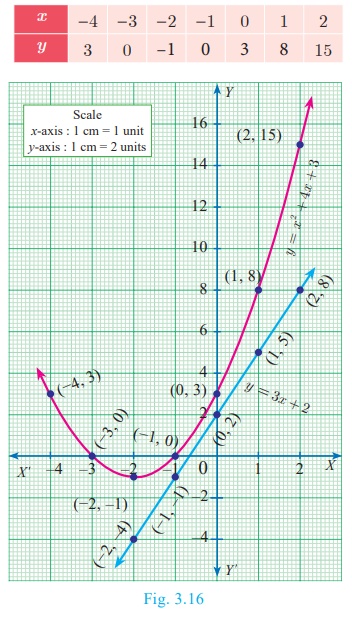
Step 2
To solve x2+x+1= 0 subtract x2+x+1=
0 from y = x 2 + 4x + 3 that is,
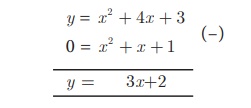
The equation represent a straight line. Draw the graph of y
= 3x+2 forming the table of values as below.

Step 3
Observe that the graph of y = 3x+2 does not
intersect or touch the graph of the parabola y = x 2 +
4x + 3.
Thus x2 + x + 1 = 0 has no real roots.
Example 3.51
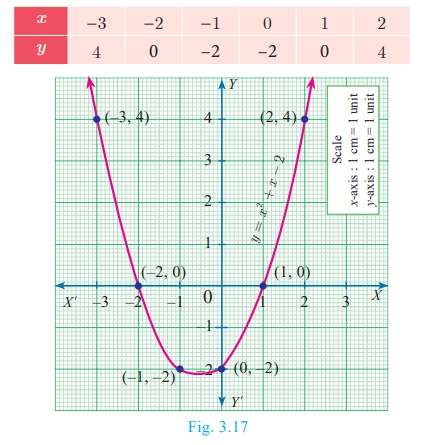
Draw the graph of y = x2 + x –
2 and hence solve x2 + x − 2
= 0 .
Solution
Step 1
Draw the graph of y = x2 + x −2 by
preparing the table of values as below
Step 2
To solve x 2 + x − 2 =
0 subtract
x2 + x – 2 = 0 from y = x2 + x
– 2 that is

The equation y = 0 represents the X axis.
Step 3
Mark the point of intersection of the curve x2
+ x − 2 with the X axis.
That is (–2,0) and (1,0)
Step 4
The x coordinates of the respective points form the solution set {−2,1} for x2 + x − 2 =0
Example 3.52
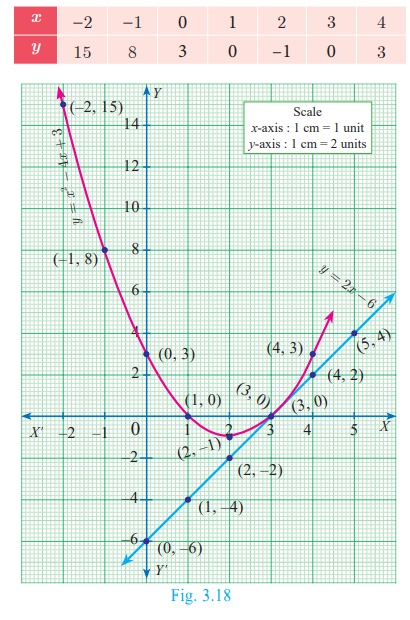
Draw the graph of y = x2 − 4x + 3 and use it to solve x2 − 6x + 9 = 0
Solution
Step 1
Draw the graph of y = x2 − 4x + 3
by preparing the table of values as below
Step 2
To solve x 2 − 6x + 9 = 0 , subtract x
2 − 6x + 9 = 0 from y = x 2 − 4x
+ 3
that is
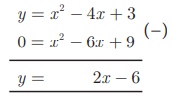
The equation y = 2x – 6 represent a straight
line. Draw the graph of y =
2x − 6 forming the table of values as below.

The line y = 2x – 6 intersect y= x
2 − 4x + 3 only at one point
Step 3
Mark the point of intersection of the curve y = x
2 − 4x + 3 and y = 2x – 6 that is (3,0).
Therefore, the x coordinate 3 is the only solution for the equation x 2 − 6x + 9 = 0.
Related Topics