Chapter: Modern Analytical Chemistry: Titrimetric Methods of Analysis
Titrations Based on Acid–Base Reactions: Characterization Applications
Characterization Applications
Two useful characterization
applications involving acid–base titrimetry are the determination of equivalent
weight, and the determination of acid–base dissociation constants.
Equivalent Weights
Acid–base
titrations can be used to characterize the chemical and physical properties of
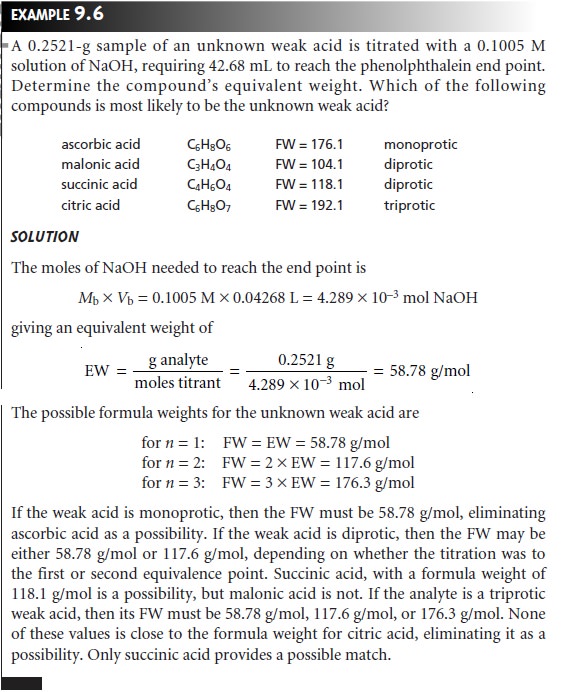
matter. One simple example is the determination of the equivalent weight* of
acids and bases. In this method, an accurately weighed sample of a pure acid or
base is titrated to a well-defined equivalence point using a monoprotic strong
acid or strong base. If we assume that the titration involves the transfer of n
protons, then the moles of titrant needed to reach the equivalence point is
given as
Moles titrant = n x moles analyte
and the formula weight is

Since the actual number of protons
transferred between the analyte and titrant is uncertain, we define the
analyte’s equivalent weight (EW) as the apparent formula weight when n = 1. The
true formula weight, therefore, is an integer multiple of the calculated
equivalent weight.
FW = n x EW
Thus, if we titrate a monoprotic
weak acid with a strong base, the EW and FW are identical. If the weak acid is
diprotic, however, and we titrate to its second equivalence point, the FW will
be twice as large as the EW.

Equilibrium Constants
Another application
of acid–base titrimetry is the determi- nation
of equilibrium constants. Consider, for example,
the titration of a weak acid,
HA, with a strong base. The dissociation constant for the weak acid is

When
the
concentrations of HA and A– are equal,
equation
9.9
reduces
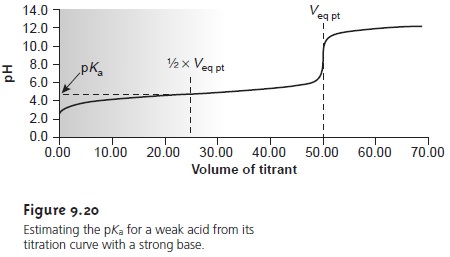
to Ka = [H3O+], or pH = pKa. Thus, the pKa for a weak
acid can be determined by measuring the pH for
a solution in which half
of the weak
acid has been
neutralized. On a titration curve, the point
of half-neutralization is approximated by the volume of titrant that is half of that needed
to reach the equivalence point.
As shown in Figure 9.20, an estimate of the weak acid’s pKa can be obtained
directly from the titra-
tion curve.

This method provides a reasonable estimate
of the pKa, provided
that the weak acid is neither too strong nor too weak. These limitations are easily appreciated by considering two limiting
cases. For the first case let’s assume
that the acid is strong enough that it is more than 50% dissociated before the titration begins. As a result
the concentration of HA before
the equivalence point
is always less
than the con- centration of A–, and
there is no point along
the titration curve
where [HA] = [A–]. At the other extreme,
if the acid is too weak, the equilibrium constant
for the titra- tion reaction

may be so small that less than 50% of HA will have reacted at the equivalence point. In this case the concentration of HA before the equivalence point is always greater than that of A–.
Determining the pKa by the half-equivalence point method overes- timates its value if the acid
is too strong
and underestimates its
value if the
acid is too weak.
A
second approach for
determining the pKa of an acid
is to replot the titration curve in a linear
form as a Gran plot.
For example, earlier
we learned that the titra- tion of a weak
acid with a strong base
can be plotted
in a linear form using
the fol- lowing equation

Plotting Vb x [H3O+] versus
Vb, for volumes less than the equivalence point
volume yields a straight line with a slope of –Ka. Other linearizations have
been developed that use
all the points
on a titration curve
or require no assumptions.
This ap- proach to determining acidity
constants has been
used to study
the acid–base prop- erties of humic acids,
which are naturally occurring, large-molecular-weight organic acids with multiple acidic
sites. In one
study, a sample
of humic acid
was found to have
six titratable sites,
three of which
were identified as carboxylic acids,
two of which were believed to be secondary
or tertiary amines,
and one of which was iden-
tified as a phenolic group.
Related Topics