Chapter: Modern Analytical Chemistry: Titrimetric Methods of Analysis
Complexometric EDTA Titration Curves
Complexometric EDTA Titration Curves
Now that we know something about EDTA’s chemical
properties, we are ready to evaluate its utility as a titrant
for the analysis
of metal ions.
To do so we need to
know the shape of a complexometric EDTA titration curve.
We saw that an acid–base titration curve shows the change in pH following the addition of titrant. The analogous result
for a titration with EDTA shows the change in pM,
where M is the metal
ion, as a function of the volume
of EDTA. In this section
we learn how to calculate the titration curve.
We then show how to quickly sketch
the titration curve using
a minimum number
of calculations.
Calculating the Titration Curve
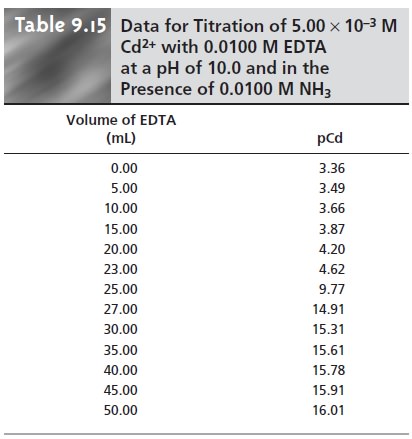
As an example, let’s calculate the
titration curve for 50.0 mL of 5.00 x 10⁻³ M
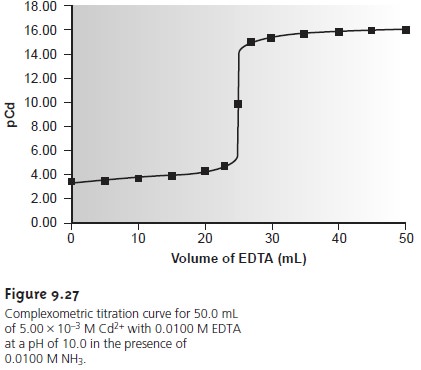
Cd2+ with 0.0100 M EDTA at a pH of 10 and in the presence of 0.0100 M NH3. The formation constant
for Cd2+–EDTA is 2.9 x 10¹⁶.
Since the titration is carried out at a pH of 10, some of the EDTA is present
in forms other than Y4–.
In addition, the presence of NH3 means
that the EDTA must compete for the Cd2+. To evaluate the titration curve, therefore, we must
use
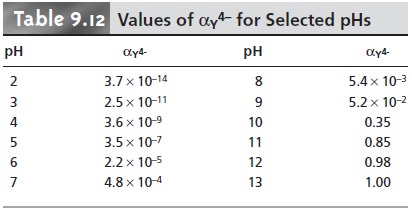
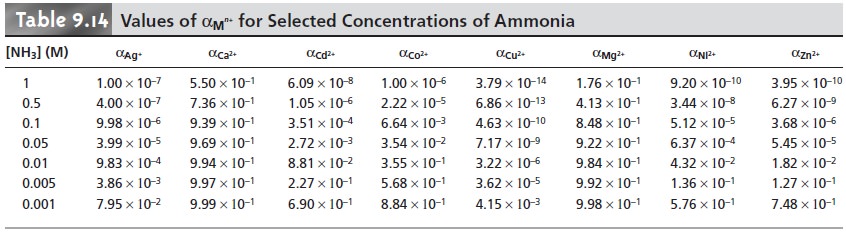
the appropriate conditional formation constant. From Tables 9.12 and
9.14 we find that αY4– is
0.35 at a pH of 10, and that αCd2+ is 0.0881 when the concentration of NH3 is 0.0100 M. Using these
values, we calculate that the con- ditional formation constant is
Kf˝ = αY4– x αCd2+ x Kf = (0.35)(0.0881)(2.9 x 10¹⁶) = 8.9 x 10¹⁴
Because
Kf˝ is so large, we treat the titration
reaction as though it proceeds to completion.
The
first task in calculating the titration curve
is to determine the volume
of EDTA needed to reach the equivalence point.
At the equivalence point we know
that
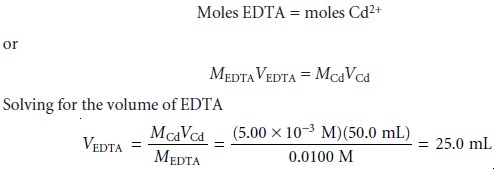
shows us that 25.0 mL of EDTA is needed to reach the equivalence
point.
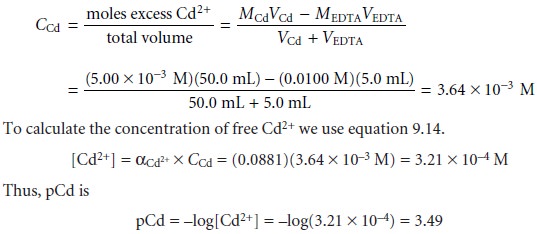
Before the equivalence point,
Cd2+ is in excess, and pCd is determined by the
concentration of free Cd2+ remaining in solution. Not all the untitrated Cd2+ is free (some is complexed with
NH3), so we will have
to account for
the presence of NH3.
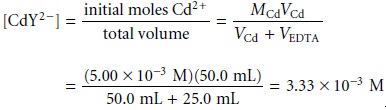
For example, after adding 5.0 mL of EDTA, the total concentration of Cd2+ is
At
the equivalence point, all the Cd2+ initially present is now present as CdY2–. The concentration of Cd2+, therefore, is determined by the dissociation of the CdY2– complex. To find pCd we must first calculate the concentration of the complex.
Letting the variable x represent the concentration of Cd2+ due to the dissociation of the CdY2– complex, we have
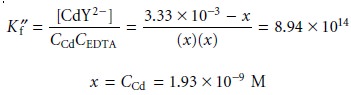
Once again, to find the [Cd2+] we must account
for the presence
of NH3; thus
[Cd2+]=
αCd2+ x CCd = (0.0881)(1.93 x 10⁻⁹ M) = 1.70 x 10⁻¹⁰ M
giving pCd as 9.77.
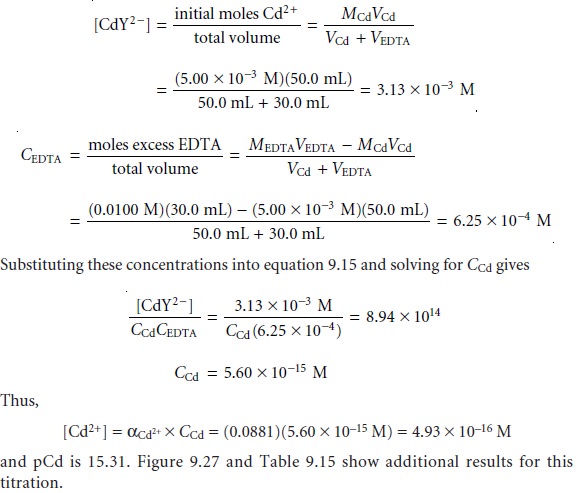
After the equivalence point, EDTA is in excess,
and the concentration of Cd2+ is
determined by the dissociation of the CdY2– complex. Examining the equation for the
complex’s conditional formation
constant (equation 9.15), we see that to calcu-
late CCd we must
first calculate [CdY2–]
and CEDTA. After adding
30.0 mL of EDTA,
these concentrations are
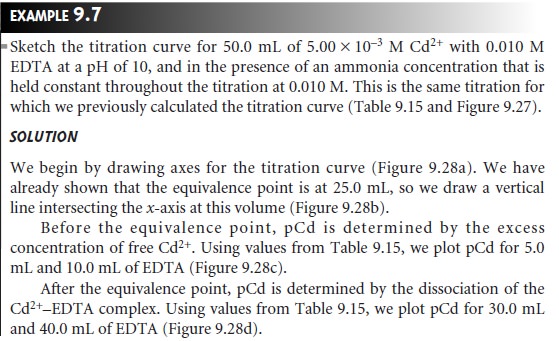
Sketching an EDTA Titration Curve
Our strategy
for sketching an EDTA titration curve is similar to that for sketching an acid–base titration curve. We begin
by drawing axes, placing
pM on the y-axis
and volume of EDTA on the x-axis. After calculating the volume of EDTA needed
to reach the equivalence point,
we add a vertical line intersecting the x-axis
at this volume.
Next we calculate and plot two values of pM for
volumes of EDTA
before the equivalence point and two
values of pM for volumes after
the equivalence point.
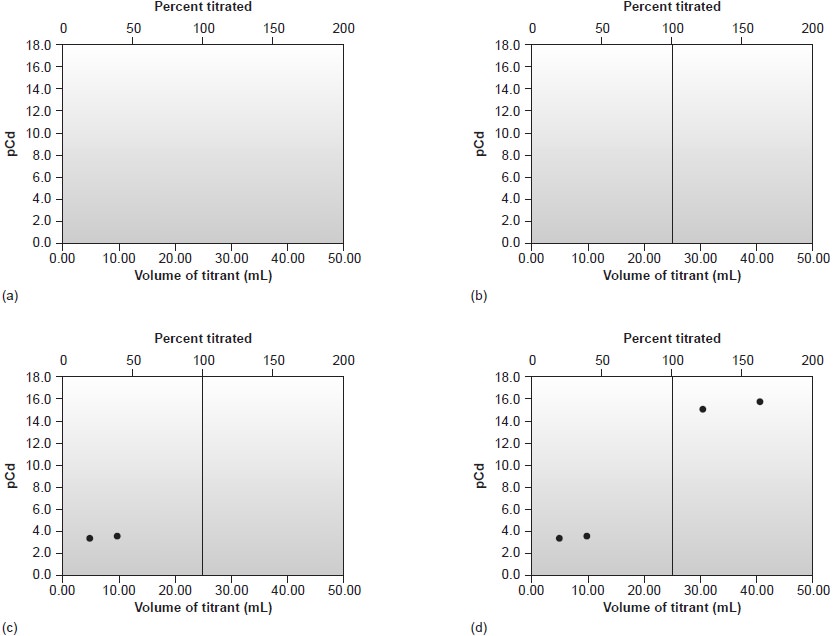
Straight lines are drawn through
each pair of points.
Finally, a smooth
curve is drawn
connecting the three
straight-line segments.
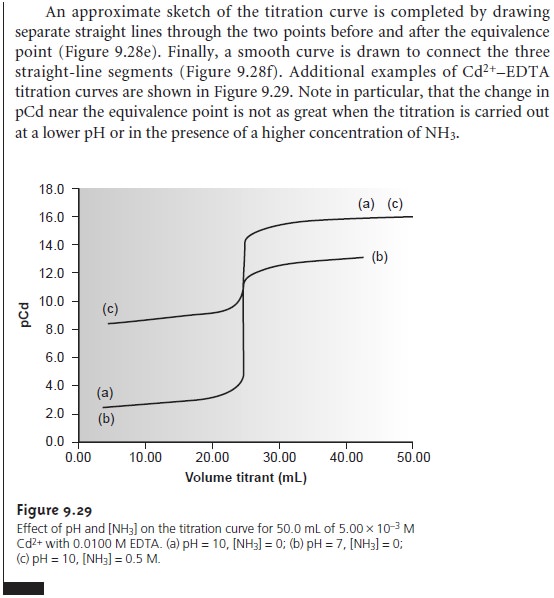
Related Topics