Chapter: Modern Analytical Chemistry: Titrimetric Methods of Analysis
Selecting and Evaluating the End Point - Titrations Based on Acid–Base Reactions
Selecting and Evaluating the End Point
Earlier we made an important
distinction between an end point and an equivalence
point. The difference between these
two terms is important and deserves repeating. The equivalence point occurs
when stoichiometrically equal
amounts of analyte
and titrant react. For example, if the analyte
is a triprotic weak acid,
a titration with NaOH will have three
equivalence points corresponding to the addition
of one, two, and
three moles of OH– for each mole of the weak
acid. An equivalence point, therefore, is a theoretical not an experimental value.
An end point
for a titration is determined experimentally and represents the analyst’s best estimate
of the corresponding equivalence point.
Any difference be- tween an equivalence point and its end point is a source of determinate error. As we shall
see, it is even possible that an equivalence point will not
have an associated end point.
Where Is the Equivalence Point?
We have already
learned how to calculate the equivalence point for the
titration of a strong acid
with a strong
base, and for
the titration of a weak acid with a strong base.
We also have learned to sketch a titra-
tion curve with a minimum
of calculations. Can we also locate the equivalence
point without performing any calculations? The answer, as you may have guessed, is often yes!
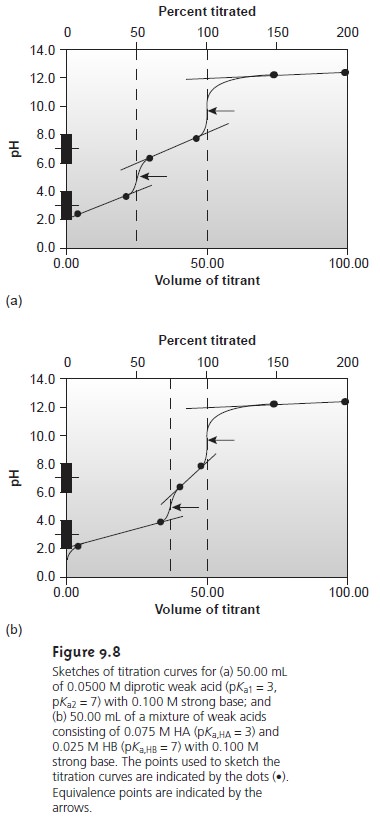
It has been shown3 that for most acid–base
titrations the inflection
point, which corresponds to the greatest
slope in the titration curve,
very nearly coincides with the equivalence point. The
inflection point actually precedes the equivalence
point, with the error approaching 0.1% for weak acids or weak bases with dissocia- tion constants smaller than
10–9, or for very
dilute solutions. Equivalence points de-
termined in this fashion are indicated on the titration curves in Figure
9.8.
The principal limitation to using a titration curve
to locate the equivalence
point is that an inflection point must be present. Sometimes, however, an inflection point may be missing
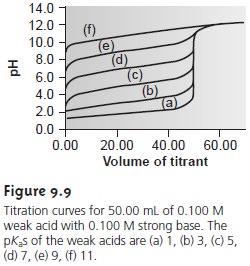
or difficult to detect. Figure
9.9, for example,
demonstrates the influence of the acid dissociation constant,
Ka, on the titration
curve for a weak
acid with a strong base
titrant. The inflection point is visible, even if barely
so, for acid dissociation constants larger than 10–9, but is missing
when Ka is 10–11.
Another situation in which
an inflection point
may be missing or difficult to detect occurs when the analyte
is a multiprotic weak acid or base whose successive dissociation constants are similar in magnitude. To see why
this is true
let’s con- sider the titration of a diprotic
weak acid, H2A, with NaOH. During
the titration the following two reactions occur.
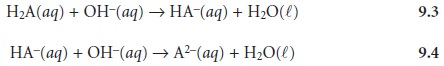
Two distinct inflection points are seen if reaction 9.3 is
essentially complete before reaction 9.4 begins.
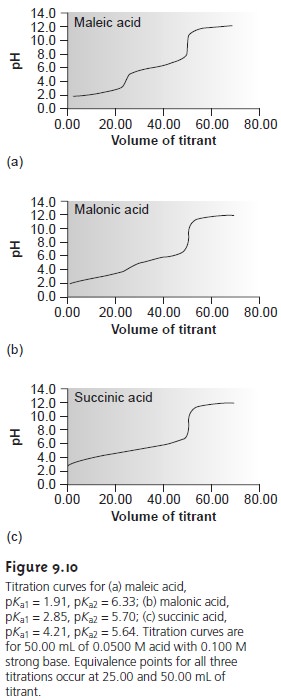
Figure 9.10 shows titration curves for three
diprotic weak acids.
The titra- tion curve for maleic acid, for which Ka1 is approximately 20,000 times larger than Ka2, shows
two very distinct
inflection points. Malonic
acid, on the other
hand, has acid dissociation constants that differ by a factor
of approximately 690. Although
malonic acid’s titration curve shows two inflection points,
the first is not as distinct
as that for maleic acid.
Finally, the titration curve for suc- cinic acid, for which
the two Ka values
differ by a factor of only 27,
has only a single inflection point corresponding to the neutralization of HC4H4O4– to C4H O 2–. In general, separate
inflection points are seen when successive acid dissociation constants differ by a
factor of at least 500 (a ∆pKa
of at least 2.7).
Finding the End Point with a Visual Indicator
One interesting group of weak acids and bases are
derivatives of organic
dyes. Because such com- pounds have at least
one conjugate acid–base species that is highly colored, their titration results in a change
in both pH and color.
This change in color
can serve as a useful
means for determining the end point
of a titration, pro-
vided that it occurs at the titration’s equivalence point.
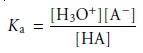
The pH at which an acid–base indicator changes color is determined by its
acid dissociation constant. For an indicator that is a monoprotic weak acid, HIn, the following
dissociation reaction occurs
HIn(aq)+ H2O(l) < == == > H3O+(aq)+
In–(aq)
for which the equilibrium constant
is
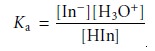 9.5
9.5
Taking the negative
log of each side of equation 9.5, and rearranging to solve for pH
gives a familiar equation.
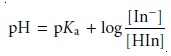 9.6
9.6
The two forms
of the indicator, HIn and In–,
have different colors.
The color of a solution containing an indicator, therefore, continuously changes as the concen- tration of HIn decreases and the concentration of In– increases. If we assume
that both HIn and
In– can be detected with
equal ease, then
the transition between
the two colors reaches
its midpoint when their concentrations are identical or when the pH
is equal to the indicator’s pKa. The
equivalence point and
the end point
coin- cide, therefore, if an indicator is selected whose
pKa is equal to the pH at the equiva-
lence point, and the titration
is continued until the indicator’s color is exactly halfway between that for HIn and In–. Unfortunately, the exact pH at the equiva-
lence point is rarely known.
In addition, detecting the point where
the concentra- tions of HIn and In– are equal may be difficult if the change
in color is subtle.
We can establish a range of pHs over which the average analyst will observe a change in color if we assume that a solution of the indicator is the color of HIn whenever its concentration is ten times more than that of In–, and the color of In– whenever the concentration of HIn is ten times less than that of In–.
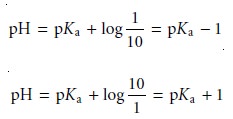
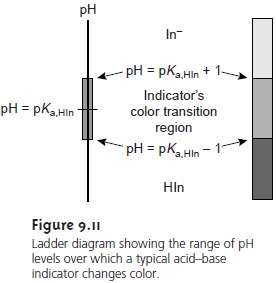
Substi- tuting these inequalities into equation 9.6 shows that an indicator changes color over
a pH range of ±1 units on either
side of its pKa (Figure 9.11). Thus,
the indicator will
be the color
of HIn when the pH is less
than pKa – 1, and the
color of In– for pHs
greater than pKa + 1.
The pH range
of an indicator does not have to be equally
distributed on either side of the
indicator’s pKa. For some indicators only the weak
acid or weak
base is col- ored. For other indicators both the weak acid and weak base are colored,
but one form may
be easier to see. In either case,
the pH range
is skewed toward
those pH lev- els for which the less colored
form of the indicator is present in higher concentration.
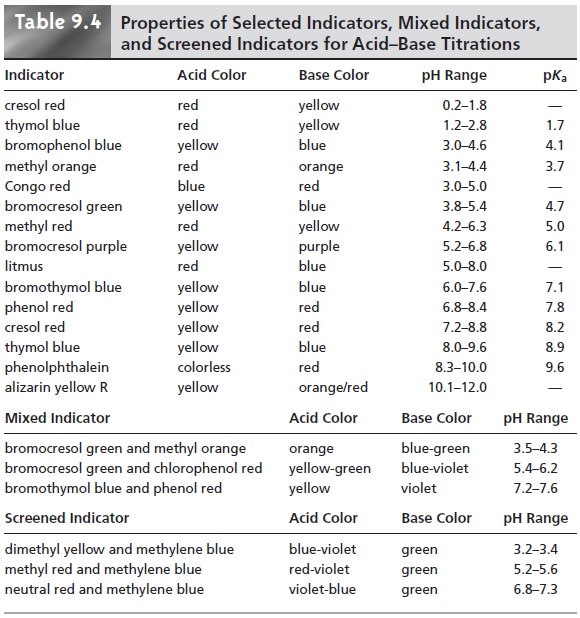
A list of several common acid–base indicators, along with their pKas, color changes, and pH ranges, is provided in the top portion of Table 9.4.
In some cases, mixed indicators, which are a mixture of two or more acid–base
indicators, provide a narrower
range of pHs over which
the color change
occurs. A few examples of such
mixed indicators are
included in the
middle portion of Table 9.4.
Adding a neutral screening dye, such as methylene blue,
also has been found to narrow the pH
range over which an indicator
changes color (lower portion of Table 9.4). In
this case, the neutral dye
provides a gray
color at the
midpoint of the
indicator’s color transition.
The relatively
broad range of pHs over which any indicator
changes color places additional limitations on the feasibility of a titration. To minimize a determi-
nate titration error,
an indicator’s entire
color transition must lie within
the sharp transition in pH occurring
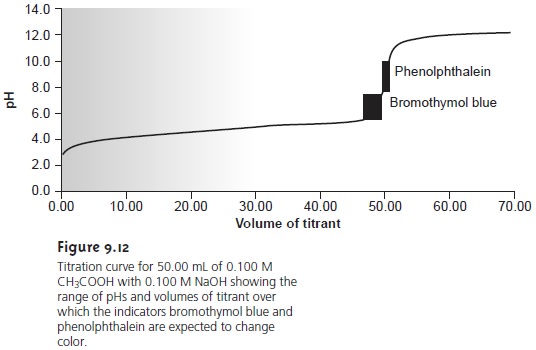
near the equivalence point. Thus, in Figure 9.12 we see that
phenolphthalein is an appropriate indicator for the titration of 0.1 M acetic
acid with 0.1 M NaOH.
Bromothymol blue, on the other
hand, is an inappropriate
indicator since its change in color begins
before the initial
sharp rise in pH and, as a result, spans a relatively large range of volumes. The
early change in color increases the probability of obtaining
inaccurate results, and the range of possible
end point volumes increases the probability of obtaining imprecise results.
The need for the indicator’s color transition to occur in the sharply
rising por- tion of the titration
curve justifies our earlier statement
that not every equivalence
point has an end point. For example,
trying to use a visual indicator to find the first
equivalence point in the titration of succinic acid
(see Figure 9.10c)
is pointless since any difference between
the equivalence point
and the end point leads
to a large titration error.
Finding the End Point by Monitoring pH
An alternative approach
to finding a titration’s end point is to monitor
the titration reaction
with a suitable
sensor whose signal
changes as a function of the analyte’s concentration. Plotting the data
gives us the resulting titration curve. The end point may then be determined from the
titration curve with
only a minimal
error.
The
most obvious sensor
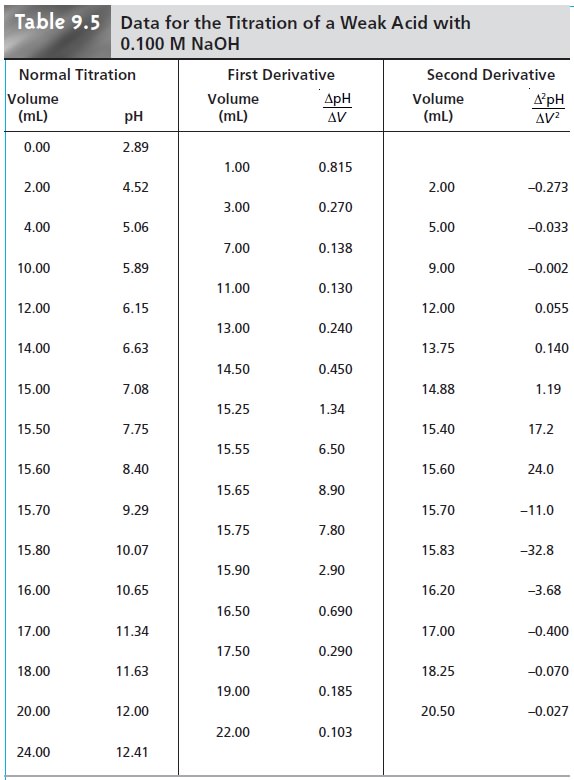
for an acid–base titration is a pH electrode.* For ex- ample, Table
9.5 lists values
for the pH and volume
of titrant obtained
during the titration of a weak acid with NaOH. The resulting titration curve, which is called a potentiometric titration curve, is
shown in Figure 9.13a. The simplest method
for finding the end point is to visually
locate the inflection point of the titration curve. This is also the least accurate
method, particularly if the titration curve’s slope at the
equivalence point is small.
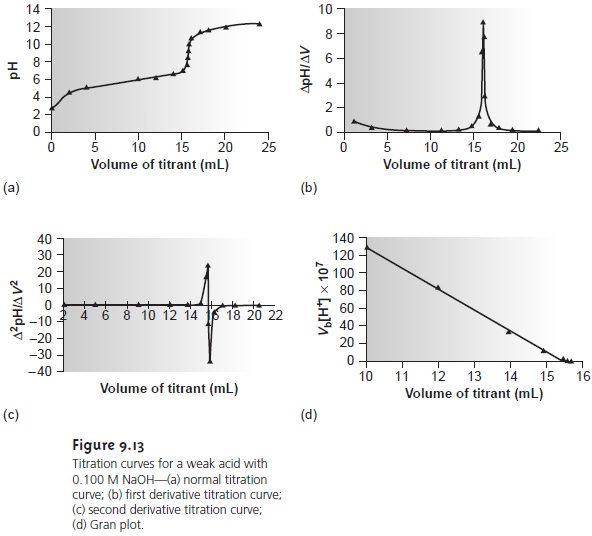
The
second derivative of a titration
curve may be more useful than the first de- rivative, since the end
point is indicated by its intersection with the volume
axis. The second derivative is approximated as ∆(∆pH/∆V)/∆V, or
∆2pH/∆V 2. For
the titration data in Table 9.5,
the initial point
in the second
derivative titration curve
is
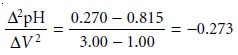
and is plotted
as the average of the two volumes
(2.00 mL). The remainder of the
data for the second derivative titration curve are
shown in Table
9.5 and plotted
in Figure 9.13c.
Derivative methods are
particularly well suited
for locating end
points in multi- protic and multicomponent systems,
in which the use of separate visual
indicators for each end
point is impractical. The precision with
which the end
point may be located also makes derivative methods
attractive for the analysis of samples with poorly defined normal titration curves.
Derivative methods work
well only when
sufficient data are
recorded during the sharp rise in pH occurring
near the equivalence point. This is usually not a
problem when the titration is conducted with
an automatic titrator, particularly when operated under computer control.
Manual titrations, however,
often contain only a few data points in the equivalence point region, due to the limited range
of volumes over which
the transition in pH occurs.
Manual titrations are, however,
information-rich during the more gently
rising portions of the titration curve be- fore and after the equivalence point.
Consider again the titration
of a monoprotic weak acid, HA, with a strong base.
At any point during the
titration the weak
acid is in equilibrium with
H3O+ and A–

Before the equivalence point,
and for volumes
of titrant in the titration curve’s buffer region, the concentrations of HA and A– are given by the following equations.
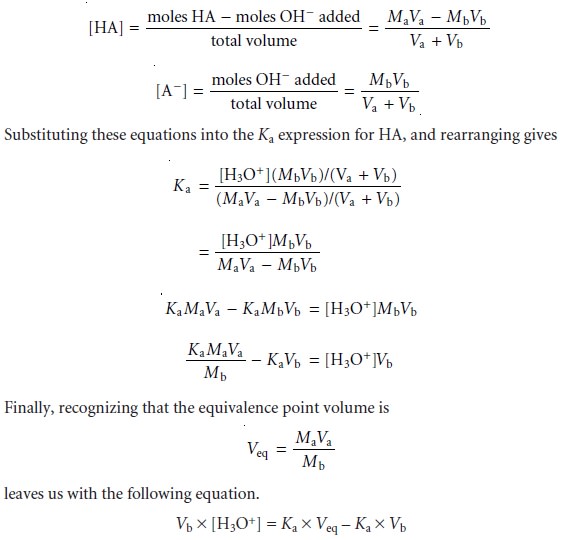
For volumes of titrant before
the equivalence point,
a plot of Vb x [H3O+] versus
Vb is a straight line
with an x-intercept equal
to the volume
of titrant at the end
point and a slope
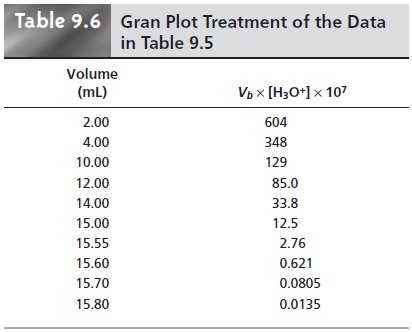
equal to –Ka.* Results
for the data in Table
9.5 are shown
in Table 9.6 and
plotted in Figure
9.13d. Plots such
as this, which
convert a portion
of a titration curve into a straight line, are called
Gran plots.
Finding the End Point by Monitoring Temperature
The
reaction between an acid
and a base is exothermic. Heat generated by the reaction increases the temperature of the titration mixture. The progress of the titration, therefore, can be followed by monitoring the change in temperature.
An idealized thermometric titration curve (Figure 9.14a) consists of three distinct linear regions. Before adding titrant, any change in temperature is due to the cooling or warming of the solution containing the analyte. Adding titrant ini- tiates the exothermic acid–base reaction, resulting in an increase in temperature. This part of a thermometric titration curve is called the titration branch.
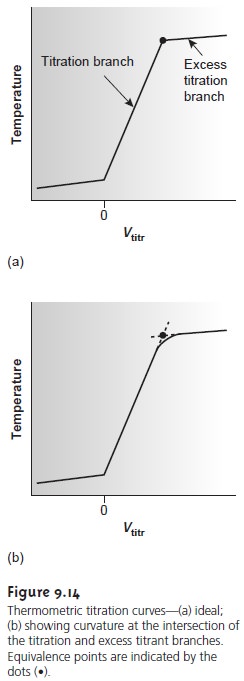
The temperature continues to rise with
each addition of titrant until
the equivalence point is reached. After
the equivalence point,
any change in temperature is due to the
difference between the temperatures of the analytical solution and the titrant,
and the enthalpy of dilution for the excess
titrant. Actual thermometric titration curves (Figure 9.14b) frequently show curvature at the intersection of the titration branch and the excess
titrant branch due to the incompleteness of the neutraliza- tion reaction, or excessive dilution of the
analyte during the
titration. The latter problem is minimized by using a titrant that is 10–100
times more concentrated than the analyte, although
this results in a very small end point volume and a larger relative error.
The end point is indicated
by the intersection of the titration branch and the excess
titrant branch. In the idealized thermometric titration curve (see Figure 9.14a) the end point is easily located.
When the intersection between
the two branches
is curved, the end point can be found by extrapolation
(Figure 9.14b).
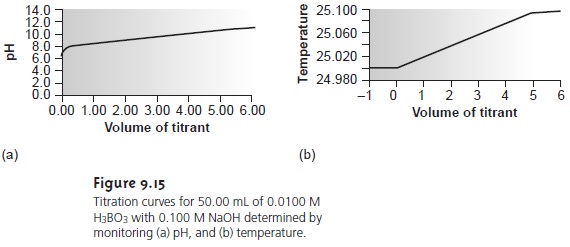
Although not commonly used, thermometric titrations have one distinct ad- vantage over methods based on the direct or indirect monitoring of pH. As dis- cussed earlier, visual indicators and potentiometric titration curves are limited by the magnitude of the relevant equilibrium constants. For example, the titra- tion of boric acid, H3BO3, for which Ka is 5.8 x 10⁻¹⁰, yields a poorly defined equivalence point (Figure 9.15a). The enthalpy of neutralization for boric acid with NaOH, however, is only 23% less than that for a strong acid (–42.7 kJ/mol for H3BO3 versus –55.6 kJ/mol for HCl), resulting in a favorable thermometric titration curve (Figure 9.15b).
Related Topics