Chapter: Modern Analytical Chemistry: Titrimetric Methods of Analysis
Selecting and Evaluating the End Point - Titrations Based on Complexation Reactions
Selecting and Evaluating the End Point
The equivalence point of a complexation titration occurs when stoichiometri-
cally equivalent amounts
of analyte and titrant have reacted. For titrations in- volving metal
ions and EDTA,
the equivalence point
occurs when CM and CEDTA are equal and may be located
visually by looking
for the titration curve’s inflec- tion point.
As
with acid–base titrations, the equivalence point of a complexation titration is estimated by an experimental end
point. A variety
of methods have
been used to find
the end point,
including visual indicators and sensors that respond to a change in the solution conditions. Typical examples of sensors include
recording a poten- tiometric titration curve using an
ion-selective electrode (analogous to measuring
pH with a pH electrode),* monitoring the temperature of the titration mixture, and
monitoring the absorbance of electromagnetic radiation by the titration mixture.
The
first two sensors
were discussed for acid–base titrations and are not considered further in this section.
Finding the End Point with a Visual Indicator
Most indicators for complexation
titrations are organic
dyes that form stable complexes with metal ions.
These dyes are known as metallochromic indicators. To function as an indicator for an EDTA titration, the metal–indicator complex
must possess a color different from that of the
uncomplexed indicator. Furthermore, the formation constant for the metal–indicator complex
must be less favorable than that for the metal–EDTA complex.
The indicator, Inm–,
is added to the solution of analyte, forming
a colored metal–indicator complex,
MInn-m. As EDTA is added, it reacts first with the free an- alyte, and then displaces the analyte from the metal–indicator complex, affecting a change in the solution’s color. The accuracy of the end point depends on the strength of the metal–indicator complex relative to that of the metal–EDTA com- plex. If the metal–indicator complex
is too strong, the color
change occurs after
the equivalence point. If the metal–indicator complex is too
weak, however, the
end point is signaled
before reaching the equivalence point.
Most metallochromic indicators also are weak acids or bases. The condi- tional formation constant for the
metal–indicator complex, therefore, depends on the solution’s pH. This
provides some control
over the indicator’s titration error.
The apparent strength of a metal–indicator complex
can be adjusted by controlling the pH at which
the titration is carried out. Unfortunately, because
they also are acid–base indicators, the color
of the uncomplexed indicator changes
with pH. For example, calmagite, which we may represent
as H3In, undergoes
a change in color
from the red of H2In– to the blue of HIn2– at
a pH of approximately 8.1, and from the
blue of HIn2– to the
red-orange of In3– at a pH of approximately 12.4.
Since the color of calmagite’s metal–indicator complexes are red, it is only useful
as a metal- lochromic indicator in the pH range of 9–11, at which almost
all the indicator is present as HIn2–.

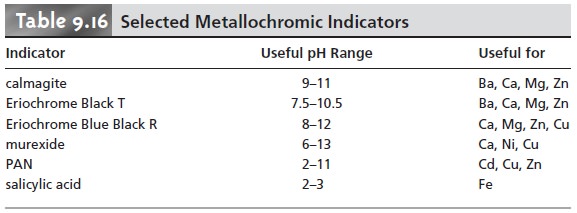
A partial list of metallochromic indicators, and the metal ions and pH condi- tions for which they are useful, is given in Table 9.16. Even when a suitable indica- tor does not exist, it is often possible to conduct an EDTA titration by introducing a small amount of a secondary metal–EDTA complex, provided that the secondary metal ion forms a stronger complex with the indicator and a weaker complex with EDTA than the analyte.
For example, calmagite can be used in the determination of Ca2+ if a small amount
of Mg2+–EDTA is added to the solution containing the ana- lyte. The Mg2+ is displaced from the EDTA by Ca2+, freeing
the Mg2+
to form the red
Mg2+–indicator complex. After all the
Ca2+ has been titrated, Mg2+ is displaced from the Mg2+–indicator complex
by EDTA, signaling the end point
by the pres- ence of the uncomplexed indicator’s blue form.
Finding the End Point by Monitoring Absorbance.
An important limitation when using a visual indicator is the need to observe
the change in color signal-
ing the end
point. This may
be difficult when the solution is already
colored. For example, ammonia is used to adjust the pH of solutions
containing Cu2+ before
its titration
with EDTA. The presence of
the intensely
colored Cu(NH3)42+ complex obscures the
indicator’s color, making an accurate
deter- mination of the
end point difficult.
Other absorbing species present within the sample matrix may also interfere in a similar fashion. This is often a problem when analyzing
clinical samples such as blood or environmental samples such as
natural waters.
As long as at least one species in a complexation titration absorbs electro-
magnetic radiation, the
equivalence point can
be located by monitoring the
ab- sorbance of the
analytical solution at a carefully selected wavelength.* For
ex- ample, the equivalence
point for the titration of Cu2+ with EDTA, in the presence
of NH3, can be located by monitoring
the absorbance at a wavelength of 745 nm, where the Cu(NH3)42+ complex absorbs strongly. At the beginning
of the titration the absorbance
is at a maximum.
As EDTA is added, however,
the reaction
|
3 4 3 |
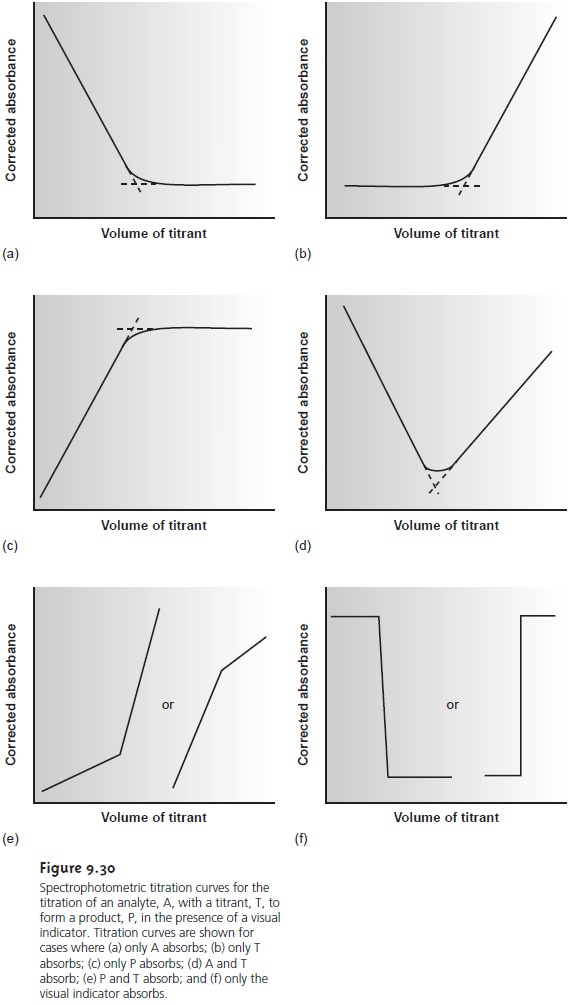
occurs, decreasing both the concentration of Cu(NH3)42+ and the absorbance. The absorbance reaches a minimum at the equivalence point and remains essen- tially unchanged as EDTA is added in excess. The resulting spectrophotometric titration curve is shown in Figure 9.30a.

In order to keep the individual segments of the titration curve linear, the measured absorbance, Ameas, is corrected for dilution

where Acorr is the corrected absorbance, and VEDTA and VCu are, respectively, the volumes of EDTA and Cu. The equivalence point
is given by the intersection of the linear segments, which are extrapolated if necessary to correct for any curvature in the titration curve. Other common spectrophotometric
titration curves are shown in
Figures 9.30b–f.
Related Topics