Chapter: Modern Analytical Chemistry: Titrimetric Methods of Analysis
Redox Titration Curves
Redox Titration Curves
To evaluate a redox titration we must know
the shape of its titration curve. In an acid–base titration or a complexation titration, a titration curve
shows the change in concentration of H3O+
(as pH) or Mn+ (as pM)
as a function of the
volume of titrant. For a redox
titration, it is convenient to monitor electrochemical potential.
You will recall
that the Nernst
equation relates the electro-
chemical potential to the concentrations of reactants and products participating in a redox reaction.
Consider, for example,
a titration in which the analyte in a reduced state, Ared, is titrated with
a titrant in an oxidized state, Tox. The titration reaction is
Ared + Tox < == == > Tred + Aox
The electrochemical potential
for the reaction is the difference between
the reduc- tion potentials for the reduction and oxidation half-reactions; thus,
Erxn = ETox/Tred – EAox/Ared
After each addition of titrant, the
reaction between the
analyte and titrant
reaches a state of equilibrium. The
reaction’s electrochemical potential, Erxn, therefore, is zero, and
ETox/Tred
= EAox
/Ared
Consequently, the potential for either half-reaction may be used to monitor
the titration’s progress.
Before the equivalence point
the titration mixture
consists of appreciable quan- tities of both
the oxidized and
reduced forms of the analyte, but very little
unreacted titrant. The potential, therefore, is best calculated using
the Nernst equation
for the analyte’s half-reaction
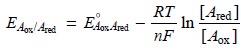
Although E˚Aox /Ared is the standard-state potential for the analyte’s half-reaction,
a matrix-dependent formal potential is used in its place. After the equivalence
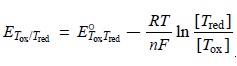
point, the potential is easiest
to calculate using the Nernst equation for the titrant’s half-reaction, since
significant quantities of its oxidized and reduced forms
are present.
Calculating the Titration Curve
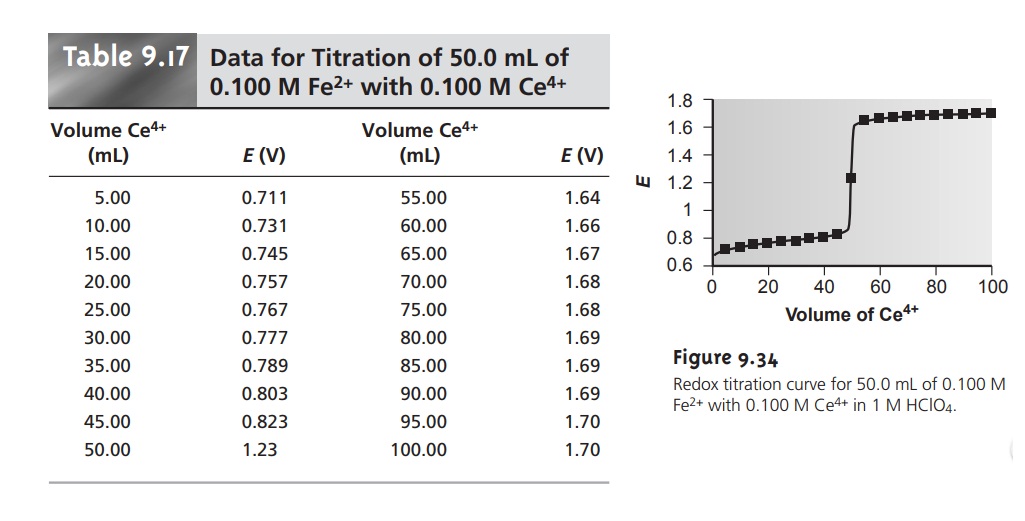
As an example, let’s calculate the
titration curve for the titration of 50.0 mL of 0.100
M Fe2+
with 0.100 M Ce4+ in a matrix of 1 M HClO4. The reaction in this case is

The
equilibrium constant
for
this
reaction
is
quite
large
(it
is
approximately 6 x 10¹⁵),
so we may assume that the analyte
and titrant react
completely.
The first task is to calculate the volume of Ce4+ needed to reach the equivalence
point. From the stoichiometry of the reaction
we know
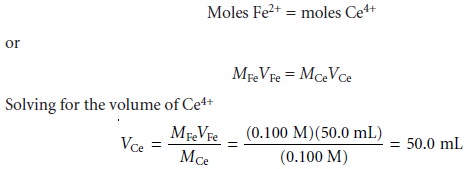
gives the equivalence point volume as 50.0 mL.
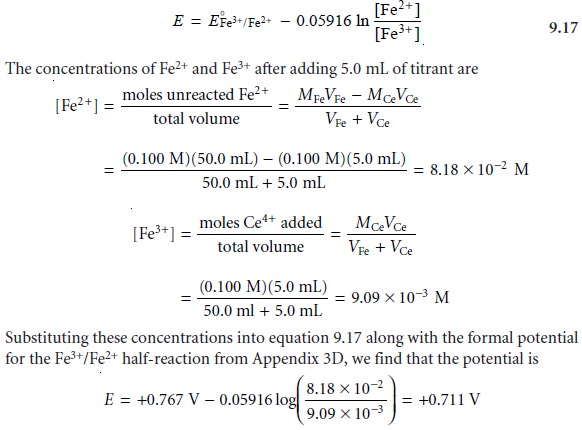
Before the equivalence point
the concentration of unreacted Fe2+ and the con-
centration of Fe3+ produced by reaction 9.16 are easy to calculate. For this reason we
find the potential using the Nernst
equation for the analyte’s half-reaction
At the equivalence point, the moles of Fe2+ initially present and the moles of Ce4+ added are equal. Because the equilibrium constant for reaction 9.16 is large, the concentrations of Fe2+ and Ce4+ are exceedingly small and difficult to calculate without resorting to a complex equilibrium problem. Consequently, we cannot cal- culate the potential at the equivalence point, Eeq, using just the Nernst equation for the analyte’s half-reaction or the titrant’s half-reaction. We can, however, calculate Eeq by combining the two Nernst equations. To do so we recognize that the poten- tials for the two half-reactions are the same; thus
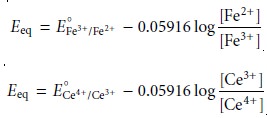
Adding together these two Nernst
equations leaves us with
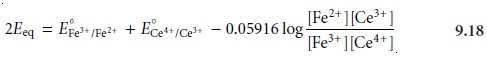
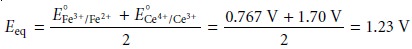
At the equivalence point, the
titration reaction’s stoichiometry requires that
The
ratio in the
log term of equation 9.18,
therefore, equals one
and the log
term is zero. Equation
9.18 simplifies to
After the equivalence point,
the concentrations of Ce3+ and excess Ce4+ are easy to calculate. The potential, therefore, is best calculated using the Nernst
equation for the titrant’s half-reaction.
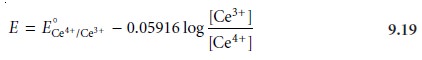
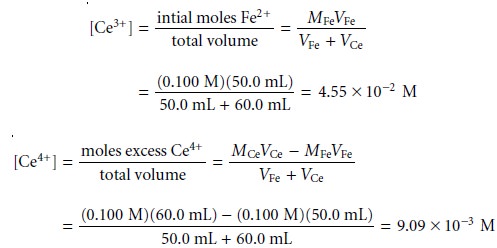
Substituting these concentrations
into equation 9.19 gives the potential as
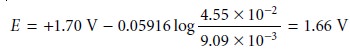
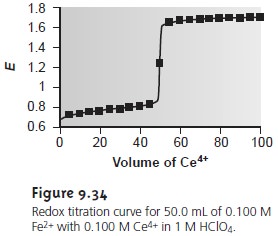
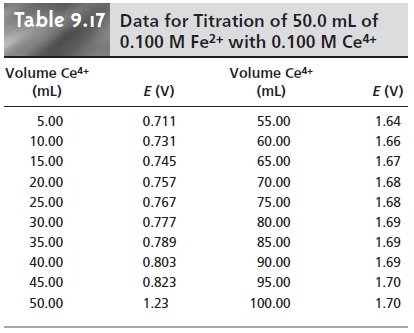
Additional results for this
titration curve are shown in Table 9.17 and Figure 9.34
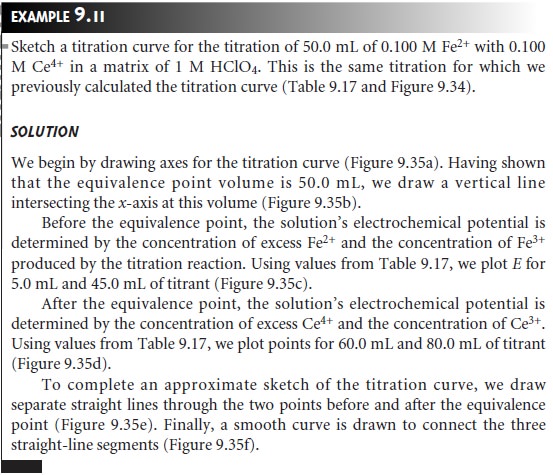
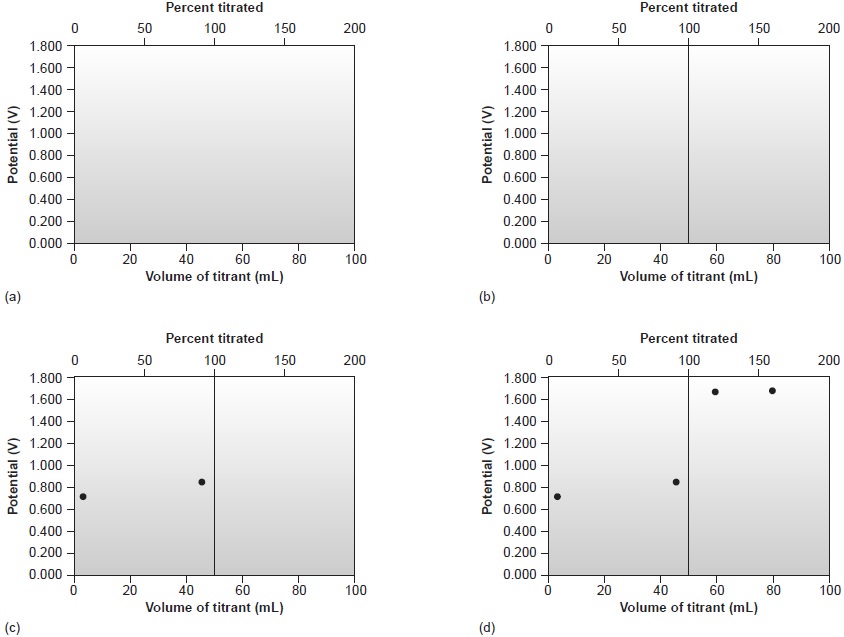
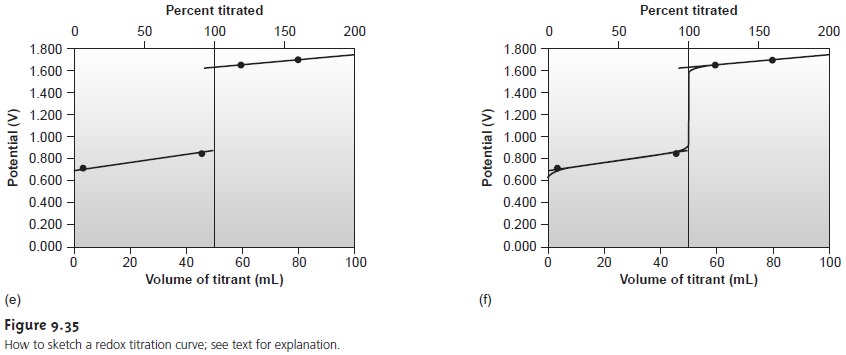
Sketching a Redox Titration Curve
As we have
done for acid–base and complexo-
metric titrations, we now show how to quickly sketch
a redox titration curve using a minimum number of calculations.
Related Topics