Chapter: Modern Analytical Chemistry: Titrimetric Methods of Analysis
Precipitation Titration Curves
Titration Curves
The titration curve
for a precipitation titration follows
the change in either the ana-
lyte’s or titrant’s concentration as a function
of the volume of titrant.
For example, in an analysis for
I– using Ag+ as a titrant
Ag+(aq)+ I–(aq)
< = = = = > AgI(s)
the
titration curve may be a plot of pAg or pI as a function
of the titrant’s volume. As we have done
with previous titrations, we first show
how to calculate the titra- tion curve
and then demonstrate how to quickly
sketch the titration curve.
Calculating the Titration Curve
As an example, let’s calculate the
titration curve for the titration of 50.0 mL of 0.0500
M Cl–
with 0.100 M Ag+. The reaction in this
case is
Ag+(aq)+ Cl–(aq) < = = = = > AgCl(s)
The equilibrium constant for the reaction is
K = (Ksp)–1 = (1.8 x 10⁻¹⁰)–1 = 5.6 x 10⁹
Since the equilibrium constant is large,
we may assume that Ag+ and
Cl– react completely.
By
now you are familiar with our approach
to calculating titration curves. The first task is to calculate the volume of Ag+ needed to reach the equivalence point. The stoichiometry of the reaction requires
that
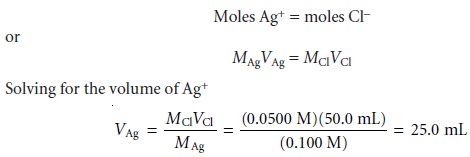
shows that we need 25.0 mL of Ag+ to reach the equivalence point.
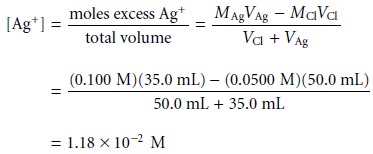
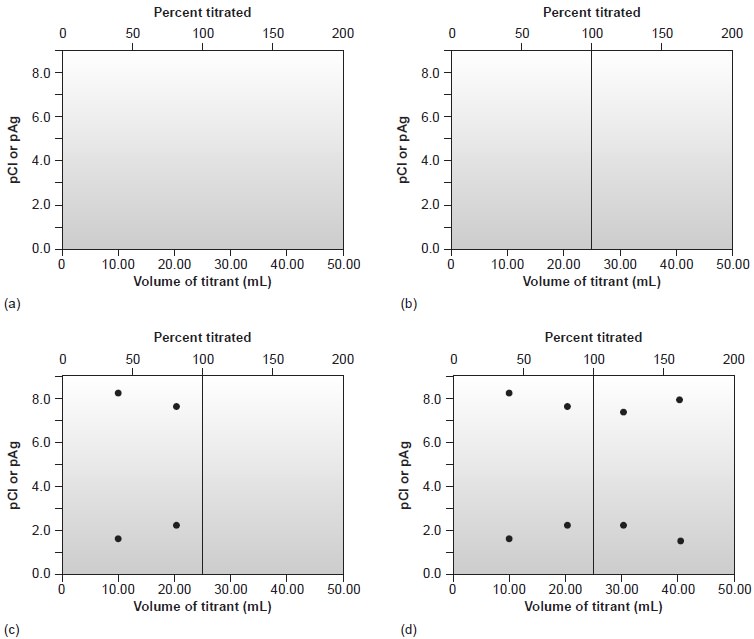
Before the equivalence point
Cl– is in excess. The concentration of unreacted
Cl– after adding 10.0 mL of Ag+,
for example, is
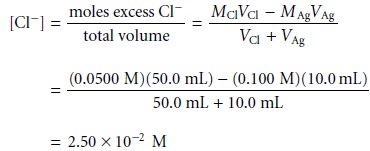
If the titration curve follows the change in concentration for Cl–, then we calculate pCl as
pCl = –log[Cl–] = –log(2.50 x 10⁻²) = 1.60
However, if we wish to follow the change in concentration for Ag+ then we must first calculate its concentration. To do so we use the Ksp expression for AgCl
Ksp = [Ag+][Cl–] = 1.8 x 10⁻¹⁰
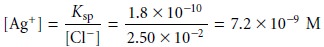
gives a pAg of 8.14.
At
the equivalence point,
we know that
the concentrations of Ag+ and Cl– are equal. Using
the solubility product
expression
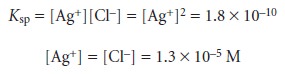
At the equivalence point, therefore, pAg and pCl are both 4.89.
After the equivalence point,
the titration mixture
contains excess Ag+. The con- centration of Ag+ after adding 35.0 mL of titrant
is
or a pCl of 7.82.
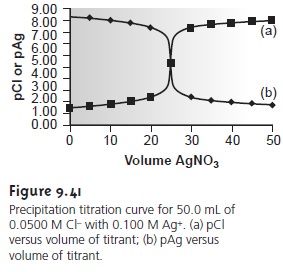
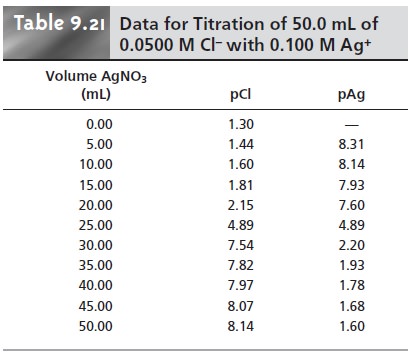
Additional results for the titration curve are shown
in Table 9.21 and Figure 9.41.
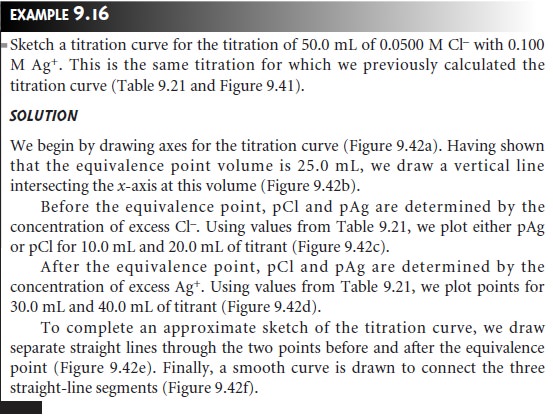
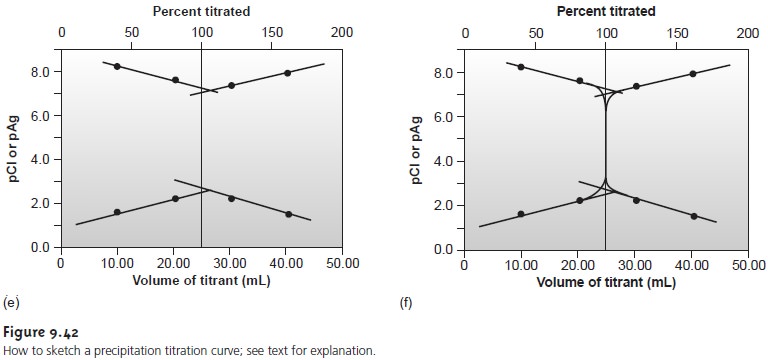
Sketching the Titration Curve
As we have done for acid–base, complexometric titrations, and redox titrations, we now show how to quickly sketch a precipitation titration curve
using a minimum
number of calculations
Related Topics