Chapter: Modern Analytical Chemistry: Spectroscopic Methods of Analysis
Spectroscopy Based on Scattering
Spectroscopy Based on Scattering
The blue color
of the sky during the day and the red color of the sun at sunset
result from the scattering of light by small particles
of dust, molecules
of water, and other
gases in the atmosphere. The efficiency with which light
is scattered depends
on its wavelength. The sky is blue because
violet and blue light are scattered to a greater extent than other, longer
wavelengths of light.
For the same
reason, the sun
appears to be red when observed
at sunset because
red light is less efficiently scattered and,
therefore, transmitted to a greater
extent than other wavelengths of light. The scat-
tering of radiation has been studied since
the late 1800s,
with applications begin- ning soon thereafter. The
earliest quantitative applications of scattering, which
date from the early
1900s, used the
elastic scattering of light to determine the
concentra- tion of colloidal
particles in a suspension.
Origin of Scattering
A focused, monochromatic beam of radiation of wavelength λ, passing through
a medium containing particles
whose largest dimensions are less than 3/2 λ is ob- served to scatter in all directions. For example, visible
radiation of 500 nm is scat- tered by particles as large as 750 nm in the
longest dimension. With
larger parti- cles, radiation
also may be reflected or refracted. Two general categories of scattering are recognized. In elastic scattering, radiation is absorbed
by the analyte and re-emitted without
a change in the radiation’s energy. When the radiation is re-emitted with a change in energy,
the scattering is said to be inelastic. Only elas- tic scattering is considered in this text.
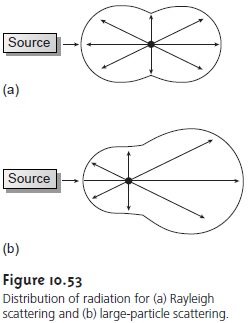
Elastic scattering is divided into two types: Rayleigh, or small-particle scatter- ing, and large-particle
scattering. Rayleigh scattering occurs when the scattering particles largest
dimension is less
than 5% of the radiation’s wavelength. The inten- sity of the scattered radiation is symmetrically distributed (Figure 10.53a)
and is proportional to its frequency to the fourth
power (v4), accounting for the greater scattering of blue light
compared with red
light. For larger
particles, the distribution of scattered light increases in the forward
direction and decreases in the backward direction as the result
of constructive and destructive interferences (Figure 10.53b).
Turbidimetry and Nephelometry
Turbidimetry and nephelometry are two related
techniques in which
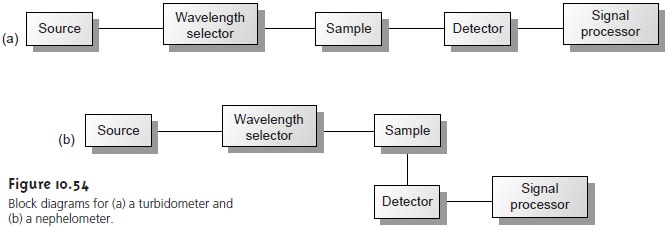
an incident source of radiation is elastically scattered by a suspension of colloidal particles. In turbidimetry, the detector
is placed in line with the radiation
source, and the decrease
in the radiation’s transmitted power is measured. In nephelometry, scat-
tered radiation is measured at an angle
of 90° to the radiation source. The similarity of the measurement of turbidimetry to absorbance, and of nephelometry to fluores- cence, is evident in the block instrumental designs
shown in Figure 10.54. In fact,
turbidity can be measured using
a UV/Vis spectrophotometer, such
as a Spectronic- 20, whereas a spectrofluorometer is suitable for nephelometry.
Turbidimetry Versus Nephelometry
Choosing between
turbidimetry and neph- elometry is determined by two principal
factors. The most important consideration is the intensity of the transmitted or scattered radiation relative to the intensity of radiation from the source.
When the solution contains a small
concentration of scattering particles, the intensity of the transmitted radiation, IT, will be very similar
to the intensity of the radiation source,
I0. As we learned
earlier in the section on molecular absorption, determining a small difference between two intense
signals is subject to a substantial uncertainty. Thus, nephelometry is a more
appropriate choice for samples
containing few scattering particles. On the other hand, tur-
bidimetry is a better choice
for samples containing a high concentration of scatter- ing particles.
The second consideration in choosing between
turbidimetry and nephelometry is the size of the scattering particles. For nephelometry, the intensity of scattered ra- diation at 90° will
be greatest if the particles are small enough
that Rayleigh scatter- ing is in effect.
For larger particles, as shown in Figure 10.37, scattering intensity
is diminished at 90°. When using
an ultraviolet or visible source
of radiation, the opti-
mum particle size is 0.1–1 μm. The size of the scattering particles is less important
for turbidimetry, in which the signal is the relative
decrease in transmitted radia- tion. In fact,
turbidimetric measurements are still feasible
even when the size of the
scattering particles results
in an increase in reflection and refraction (although a lin- ear relationship between the signal
and the concentration of scattering particles may no longer hold).
Determining Concentration by Turbidimetry
In turbidimetry the measured trans-
mittance, T, is the ratio of the transmitted intensity of the source radiation, IT, to the
intensity of source
radiation transmitted by a blank,
I0.

The relationship between
transmittance and the concentration of the scattering par- ticles is similar
to that given
by Beer’s law
–logT =
kbC ……………..10.36
where C is the concentration of the scattering particles in mass per unit volume
(w/v), b is the
pathlength, and k is
a constant that
depends on several
factors, in- cluding the size and shape of the scattering particles and the wavelength of the source
radiation. As with Beer’s law, equation 10.36
may show appreciable devia- tions from linearity. The exact relationship is established by a calibration curve pre- pared using
a series of standards of known concentration.
Determining Concentration by Nephelometry
In nephelometry, the relationship
between the intensity of scattered radiation, IS, and the concentration (% w/v) of scattering particles is given
as
IS = kSI0C ……………..10.37
where kS is an empirical constant for the
system, and I0 is the intensity of the inci- dent source radiation. The value of kS is determined from a calibration curve pre- pared using
a series of standards of known concentration.
Selecting a Wavelength for the Incident Radiation
Selecting a wavelength for the incident radiation is based primarily on the need to minimize
potential interfer- ences.
For turbidimetry, where the incident radiation is transmitted through the
sample, it is necessary to avoid radiation
that is absorbed by the sample. Since ab-
sorption is a common problem, the wavelength must
be selected with
some care, using a filter or monochromator for
wavelength selection. For
nephelometry, the absorption of incident radiation is not a problem unless
it induces fluorescence from the sample. With a nonfluorescent sample there is no need for wavelength selection, and a source of white light
may be used
as the incident radiation. When
using a filter or monochromator, other considerations include the dependence of
scattering intensity, transducer sensitivity, and source
intensity on the
wavelength. For example, many common photon transducers are more sensitive
to radiation at 400 nm than at 600 nm.
Preparing the Sample
Although equations
10.36 and 10.37 relate scattering to the concentration of scattering particles, the intensity of scattered radiation is also in- fluenced strongly by the particle’s size and shape.
For example, samples
containing the same number of scattering particles may show significantly different
values for –logT or
Is depending on the average
diameter of the particles. For a quantitative analysis, therefore, it is necessary to maintain a uniform distribution of particle sizes throughout the sample and between samples
and standards.
Most turbidimetric and
nephelometric methods rely
on the formation of the scattering particles by precipitation. As we learned
in the discussion of precipitation
gravimetry , the properties of a precipitate are determined by the condi- tions used to effect
the precipitation. To maintain a reproducible distribution of particle sizes between
samples and standards, it is necessary to control parameters such as the concentration of reagents, order of adding reagents, pH, temperature,
agitation or stirring rate, ionic strength, and time between the precipitate’s initial formation and the measurement of transmittance or scattering. In many cases
a surface-active agent, such as glycerol, gelatin, or dextrin,
is added to stabilize the precipitate in a colloidal state and to prevent the
coagulation of the
particles.
Applications
Turbidimetry and nephelometry are widely used to determine the clar- ity of water, beverages, and food products. For example, the turbidity of water is de- termined using nephelometry by comparing the
sample’s scattering to that of a set
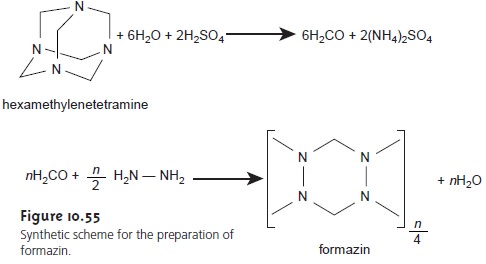
of standards. The primary
standard for measuring turbidity is formazin (Figure 10.55),
which is an easily prepared, stable polymer suspension.26 Formazin prepared
by mix- ing a 1 g/100
mL solution of hydrazine sulfate,
N2H4•H2SO4, with a 10-g/100
mL solu- tion of hexamethylenetetramine produces
a suspension that is defined
as 4000 neph- elometric turbidity units (NTU). A set of standards with
NTUs between 0 and 40 is
prepared and used to construct a calibration curve.
This method is readily adapted
to the analysis of the clarity
of orange juice,
beer, and maple
syrup.
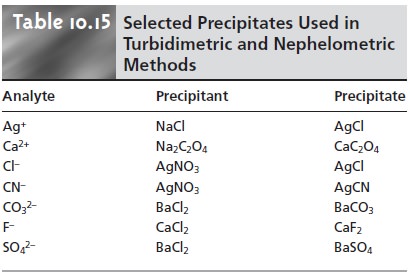
A number of inorganic cations
and anions can be determined by precipitating them under
well-defined conditions and measuring the transmittance or scattering
of radiation from the precipitated particles. The transmittance or scattering, as given
by equation 10.36
or 10.37 is proportional to the concentration of the scatter- ing particles, which, in turn, is related by the stoichiometry of the precipitation re- action to the analyte’s concentration. Examples of analytes
that have been deter- mined in this way are listed in Table 10.15. The turbidimetric determination of SO42– in water following its
precipitation as BaSO is described in Method 10.5.
Related Topics