Chapter: Modern Analytical Chemistry: Spectroscopic Methods of Analysis
Qualitative Applications - Ultraviolet-Visible and Infrared Spectrophotometry
Qualitative Applications
As discussed earlier, ultraviolet, visible and infrared
absorption bands result from the absorption of electromagnetic radiation by
specific valence electrons or bonds.
The energy at which the absorption occurs,
as well as the inten- sity of the absorption, is determined by the chemical
environment of the absorbing
moiety. For example, benzene has several
ultraviolet absorption bands due
to π - > π* transitions. The position and intensity of two of these bands,
203.5 nm (ε = 7400) and 254 nm (ε = 204), are very sensitive
to substitution. For benzoic
acid, in which a carboxylic acid group replaces
one of the aromatic hydrogens, the two bands shift to 230 nm (ε = 11,600)
and 273 nm (ε = 970). Several
rules have been developed to aid in correlating UV/Vis
absorption bands to chemical struc- ture. Similar correlations have been developed
for determining structures using in- frared
absorption bands. For example the carbonyl, C=O, stretch is very sensitive to adjacent functional groups,
occurring at 1650 cm–1 for acids, 1700 cm–1 for ke- tones, and 1800 cm–1 for acid
chlorides. The qualitative manual interpretation of UV/Vis and IR spectra
receives adequate coverage
elsewhere in the chemistry cur- riculum, notably in organic
chemistry and is therefore not considered further
in this text.
With the availability of computerized data acquisition and storage it is possible to build database libraries of standard reference spectra. When a spectrum of an un- known compound is obtained, its identity can often be determined by searching
through a library of reference spectra. This process
is known as spectral
searching. Comparisons are made by an algorithm that calculates the
cumulative difference between the absorbances of the sample
and reference spectra.
For example, one simple algorithm uses the following equation

where D is the cumulative difference, As is the absorbance of the sample
at wave- length or wavenumber i, Ar is the absorbance of the reference compound at the same
wavelength or wavenumber, and n is the number of points for which the spec-
tra were digitized. The cumulative difference is calculated for each reference
spec- trum. The reference compound with the
smallest value of D provides the
closest match to the unknown compound. The accuracy of spectral searching is limited by the
number and type
of compounds included in the library
and by the
effect of the sample’s matrix on the spectrum.
Another advantage of computerized data acquisition is the
ability to subtract one spectrum from another. When
coupled with spectral searching it may
be pos- sible, by repeatedly searching and subtracting reference spectra, to determine the identity of several
components in a sample without
the need of a prior
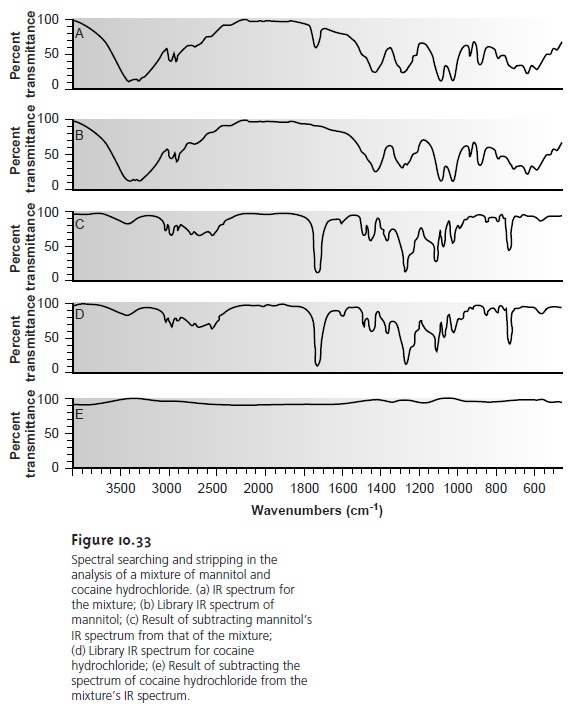
separation step. An example
is shown in Figure 10.33
in which the composition of a two- component mixture consisting of mannitol
and cocaine hydrochloride was identi-
fied by successive searching and subtraction. Figure
10.33a shows the spectrum of the
mixture. A search
of the spectral library selects
mannitol (Figure 10.33b)
as a likely component of the mixture.
Subtracting mannitol’s spectrum
from the mix- ture’s spectrum leaves a result (Figure
10.33c) that closely
matches the spectrum of cocaine hydrochloride (Figure 10.33d) in the spectral library. Subtracting
leaves only a small residual
signal (Figure 10.33e).

Related Topics