Chapter: Modern Analytical Chemistry: Spectroscopic Methods of Analysis
Quantitative Applications - Atomic Emission Spectroscopy
Quantitative Applications
Atomic emission is used for
the analysis of the same
types of samples
that may be analyzed by atomic absorption. The development of a quantitative atomic emission method
requires several considerations, including choosing a source for atomiza- tion and excitation, selecting
a wavelength and slit width, preparing the sample for analysis, minimizing spectral and chemical interferences, and selecting a method of standardization.
Choice of Atomization and Excitation Source
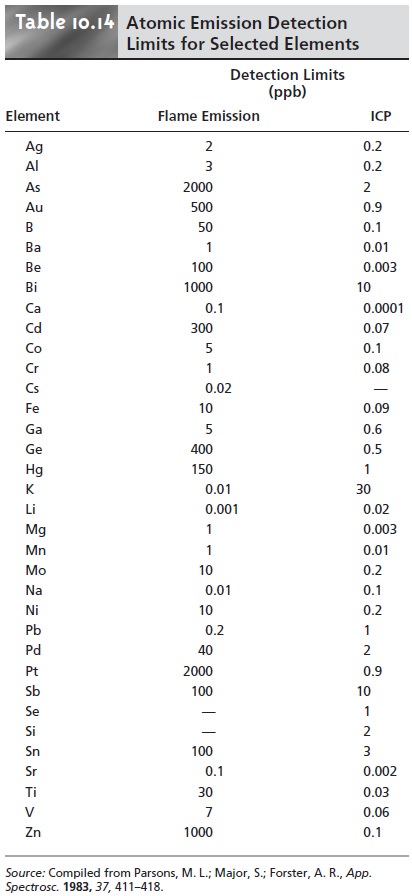
Except for the alkali metals,
detection limits when using an ICP are
significantly better than those obtained with flame emission
(Table 10.14). Plasmas also are subject to fewer spectral and chemical
interferences. For these rea- sons a plasma emission source is usually the better
choice.
Selecting the Wavelength and Slit Width
The choice of wavelength
is dictated by the need for sensitivity
and freedom from interference due to unresolved emis- sion lines from other constituents in the sample. Be- cause an atomic emission
spectrum usually has an abun- dance of emission lines,
particularly when using
a high- temperature plasma source, it is inevitable that some overlap will occur between
emission lines. For example,
an
analysis for Ni using the atomic emission line at 349.30 nm is complicated by the atomic emission line for Fe at 349.06 nm. Narrower
slit widths provide for better
resolution. The easiest approach to selecting a wavelength is to obtain an emission spectrum for the sample and
then to look
for an emission line for the
an- alyte that provides
an intense signal and is resolved
from other emission lines.
Preparing the Sample
Flame and plasma sources are best suited for the analysis of samples
in solution and liquid
form. Although solids can be analyzed by direct insertion into the flame
or plasma, they usually are first
brought into solution by digestion or extraction.
Minimizing Spectral Interferences
The most impor- tant spectral interference is a continuous source of background
emission from the flame or plasma and
emission bands from molecular
species. This back- ground emission is particularly severe for flames in which the temperature is insufficient to break down re- fractory
compounds, such as oxides and hydroxides.
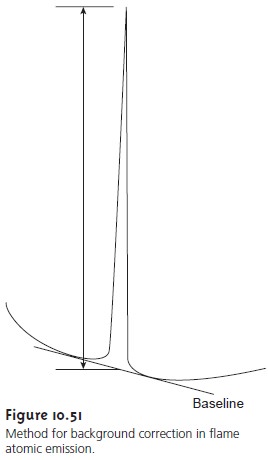
Background corrections for
flame emission are
made by scanning over
the emission line
and drawing a baseline
(Figure 10.51). Because
the temperature of a plasma
is much higher, background interferences due to molecular emission are
less prob- lematic. Emission from the plasma’s core is strong
but is insignificant at a height
of 10–30 mm above the core, where measurements normally
are made.
Minimizing Chemical Interferences
Flame emission is subject to the same types of chemical interferences as
atomic absorption. These interferences are minimized by adjusting the flame composition and adding protecting agents, releasing agents, and ionization suppressors. An additional chemical
inter- ference results
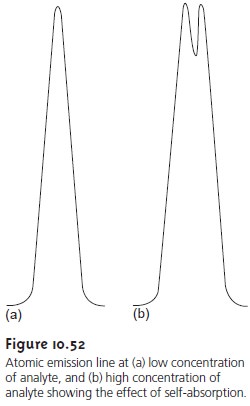
from self-absorption. Since the temperature of a flame is greatest at its center,
the concentration of analyte atoms
in an excited state is greater at the center than at the outer edges. If an excited
state atom in the center
of the flame
emits radiation while
returning to its
ground state, then ground state atoms in the cooler,
outer regions of the flame
may absorb the radiation,
thereby decreasing emission intensity. At high analyte concentra- tions a self-reversal may be seen in which
the center of the emission
band de- creases (Figure 10.52).
Chemical interferences with plasma sources generally are
insignificant. The higher temperature of the plasma limits the formation
of nonvolatile species. For example, the presence of PO43– in solutions being analyzed
for Ca2+, which is a significant interferant for flame emission, has a negligi- ble effect when using
a plasma source.
In addition, the high concentration of electrons from the ionization of argon minimizes the effects of ionization
interferences.
Standardizing the Method
Equation 10.34 shows that emission intensity is proportional to the population of the excited
state, N*, from which
the emis- sion line originates. If the emission
source is in thermal equilibrium, then the excited state
population is proportional to the total
population of analyte atoms, N, through the Boltzmann distribution (equation 10.35).
Calibration curves
for flame emission
are generally linear over two to three orders
of magnitude, with
chemical interferences due
to ionization limiting linearity for lower
concentrations of analyte,
and self-absorption limiting
linear- ity for higher
concentrations of analyte. Plasma sources, which
suffer from fewer chemical interferences, often yield
calibration curves that
are linear over
four to five orders
of magnitude and
that are not
affected significantly by changes in the matrix of the standards.
When possible, quantitative analyses are best conducted using external stan- dards. Emission intensity, however, is affected significantly by many parameters, including the temperature of the excitation source and the efficiency of atomiza- tion. An increase in temperature of 10 K, for example, results in a 4% change in the fraction of Na atoms present in the 3p excited state. The method of internal standards can be used when variations in source parameters are difficult to con- trol. In this case an internal standard is selected that has an emission line close to that of the analyte to compensate for changes in the temperature of the excita- tion source. In addition, the internal standard should be subject to the same chemical interferences to compensate for changes in atomization efficiency. To accurately compensate for these errors, the analyte and internal standard emis- sion lines must be monitored simultaneously. The method of standard additions also can be used.
Related Topics