Chapter: Modern Analytical Chemistry: Spectroscopic Methods of Analysis
Instrumentation - Molecular Photoluminescence Spectroscopy

Instrumentation
The basic design
of instrumentation for
monitoring molecular fluores- cence and molecular phosphorescence is similar to that found
for other spectroscopies. The most significant differences are discussed in the fol- lowing sections.
Molecular Fluorescence
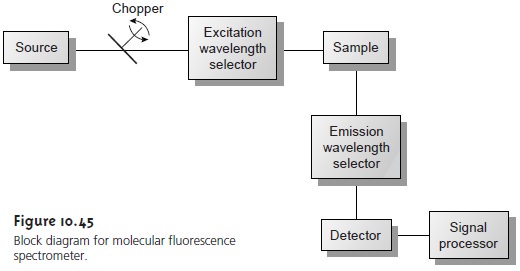
A typical instrumental block diagram for molec- ular fluorescence is shown in Figure 10.45. In contrast to instruments for absorption spectroscopy, the optical paths for the source and detector are usually positioned at an angle of 90°.

Two basic instrumental designs are used
for measuring molecular fluorescence. In a fluorometer the excitation and emission wavelengths are selected with absorp-
tion or interference filters. The
excitation source for
a fluorometer is usually
a low- pressure
mercury vapor lamp that provides intense emission lines distributed
throughout the ultraviolet and visible region
(254, 312, 365, 405, 436, 546, 577, 691,
and 773 nm). When a monochromator is used to select the excitation and emission
wavelengths, the instrument is called a spectrofluorometer. With a monochroma- tor, the excitation source
is usually a high-pressure Xe arc lamp,
which has a contin-
uum emission spectrum. Either instrumental design is appropriate for quantitative
work, although only a spectrofluorometer can be used to record
an excitation or emission spectrum.
The sample cells for molecular
fluorescence are similar
to those for optical
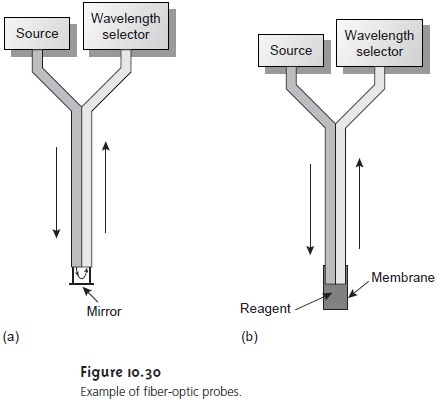
molecular absorption. Remote sensing with fiber-optic probes (see Figure 10.30)
also can be adapted for use with either a fluorometer or spectrofluorometer. An an-
alyte that is fluorescent can
be monitored directly. For analytes that
are not fluores- cent, a suitable fluorescent probe molecule can
be incorporated into
the tip of the
fiber-optic probe. The analyte’s reaction
with the probe
molecule leads to an in- crease or decrease in fluorescence.

Molecular Phosphorescence
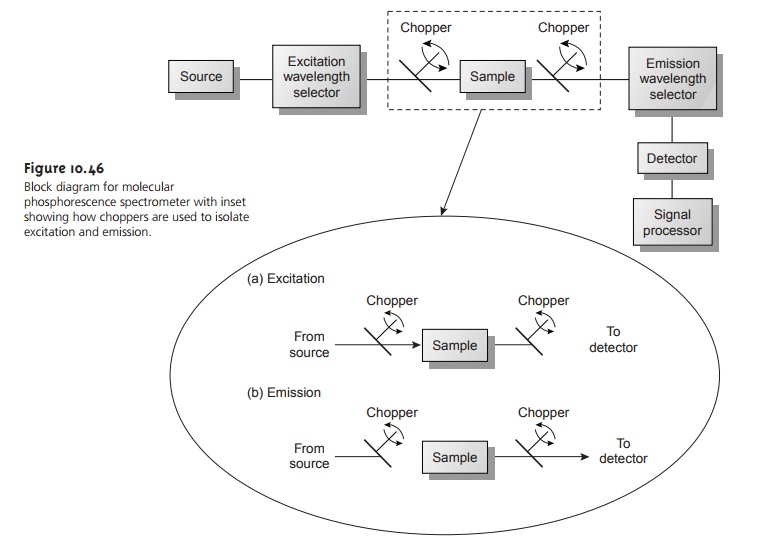
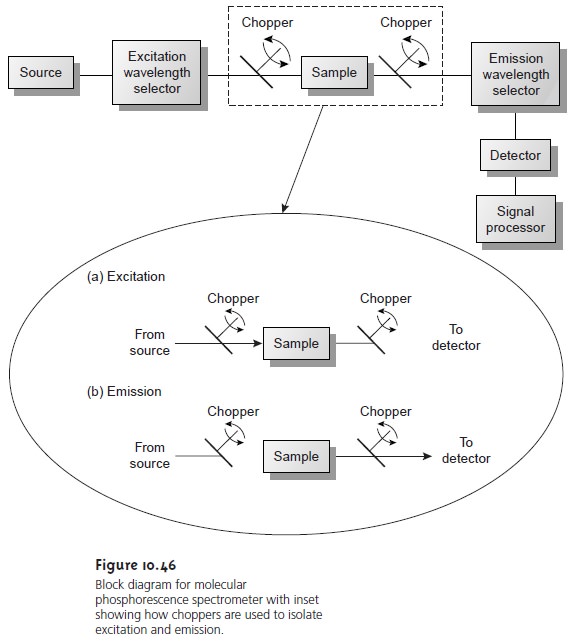
Instrumentation for molecular phosphorescence must discriminate between phosphorescence and fluorescence. Since the lifetime for fluorescence is much shorter than that for phosphorescence, discrimination is easily achieved by incorporating a delay between exciting and measuring phospho- rescent emission. A typical instrumental design is shown in Figure 10.46.

As shown in the inset, the two choppers are rotated out of phase, such that fluorescent emis- sion is blocked from the detector
when the excitation source is focused
on the sam- ple, and the excitation source
is blocked from the sample
when measuring the phos-
phorescent emission.
Because phosphorescence is such a slow process,
provision must be made to prevent deactivation of the excited state by external
conversion. Traditionally, this has
been accomplished by dissolving the sample in a suitable
organic solvent, usu- ally a mixture of ethanol, isopentane, and diethyl ether.
The resulting solution
is frozen at liquid-N2 temperatures, forming an optically clear solid. The solid matrix minimizes external conversion due to collisions between the analyte
and the sol- vent. External conversion also is minimized by immobilizing the sample on a solid substrate, allowing the measurement of phosphorescence at room temperature. One approach is to place a drop of solution containing the analyte on a small filter paper disk mounted on a sample probe.
After drying the
sample under a heat lamp,
the sample probe is placed in the spectrofluorometer for analysis. Other
solid surfaces that have been used include silica
gel, alumina, sodium
acetate, and sucrose.
This approach is particularly useful for the
analysis of thin-layer chromatography plates.
Related Topics