Chapter: Modern Analytical Chemistry: Spectroscopic Methods of Analysis
Evaluation - Ultraviolet-Visible and Infrared Spectrophotometry
Evaluation
Scale of Operation
Molecular UV/Vis
absorption is routinely used for the analysis
of trace analytes in macro
and meso samples.
Major and minor
analytes can be de-
termined by diluting samples before
analysis, and concentrating a sample may
allow for the analysis
of ultratrace analytes. The scale of operations for infrared absorp- tion is generally poorer
than that for UV/Vis absorption.
Accuracy
Under normal conditions relative
errors of 1–5% are easily
obtained with UV/Vis absorption. Accuracy is usually
limited by the
quality of the
blank. Examples of the
type of problems that may be encountered include
the presence of particulates
in a sample that scatter
radiation and interferents that react with analytical reagents. In the latter case the interferant may react to form an absorbing species,
giving rise to a positive determinate error. Interferents also may prevent
the analyte from reacting,
leading to a negative determinate error. With care,
it may be possible to improve the accuracy of an analysis
by as much as an order of magnitude.
Precision
In absorption spectroscopy, precision is limited by indeterminate er- rors, or instrumental “noise,” introduced when measuring absorbance. Precision is generally worse with very low absorbances due to the uncertainty of distin- guishing a small difference between P0 and PT, and for very high absorbances when PT approaches 0. We might expect, therefore, that precision will vary with transmittance.
We can derive
an expression between
precision and transmittance by applying the propagation of uncertainty. To do so we write
Beer’s law as
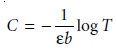 10.26
10.26
Using Table 4.9, the absolute uncertainty in the concentration, sC, is given as
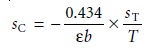 10.27
10.27
where sT is the absolute
uncertainty for the transmittance. Dividing
equation 10.27 by equation 10.26 gives the
relative uncertainty in concentration, sC/C, as
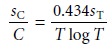
Thus, if sT is known, the
relative uncertainty in concentration can
be determined for any
transmittance.
Calculating the relative
uncertainty in concentration is complicated by the fact that
sT may be a function of the transmittance. Three categories of indeterminate
instrumental error have been observed.17 Table 10.8 provides a summary of these
categories. A constant sT is observed for
the uncertainty associated with the reading %T from a meter’s analog or digital scale. Typical values are ±0.2–0.3%
(k1 of 0.002–0.003) for an analog scale, and ±0.001%
(k1 of ±0.00001) for a digital
scale. A constant sT also
is observed for the thermal
transducers used in infrared spec- trophotometers. The
effect of a constant sT on the relative uncertainty in concen- tration is shown by curve A in Figure
10.35. Note that the relative
uncertainty is very large
for both high
and low absorbances, reaching a minimum
when the ab- sorbance is 0.434. This source of indeterminate error is important
for infrared
spectrophotometers and for inexpensive UV/Vis spectrophotometers. To obtain a
relative uncertainty in concentration of ±1–2%, the
absorbance must be kept be- tween 0.1 and 1.
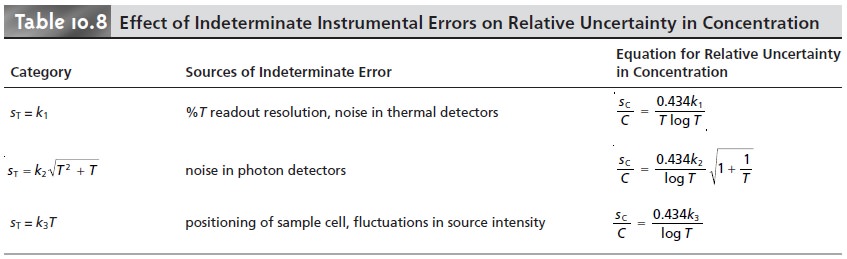
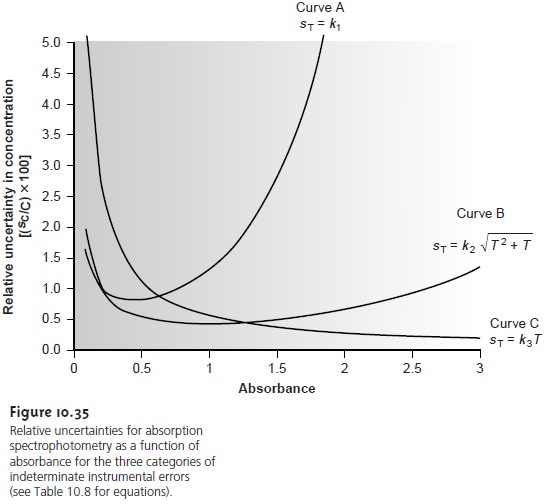
Values of sT are a complex function of transmittance when indeterminate er- rors are dominated by the noise associated with photon transducers. Curve B in Figure 10.35 shows that the relative uncertainty in concentration is very large for low absorbances, but is less affected by higher absorbances. Although the relative uncertainty reaches a minimum when the absorbance is 0.96, there is little change in the relative uncertainty for absorbances between 0.5 and 2. This source of indeterminate error generally limits the precision of high-quality UV/Vis spectropho- tometers for mid-to-high absorbances.
Finally, values of sT are directly proportional to transmittance for indetermi-
nate errors due to fluctuations in source intensity and for uncertainty in positioning the sample
cell within the spectrometer. The latter is of particular importance since the optical
properties of any sample cell are not uniform. As a result,
repositioning the sample cell
may lead to a change
in the intensity of transmitted radiation. As shown by curve
C in Figure 10.35, the effect of this source
of indeterminate error
is only important at low absorbances. This source of indeterminate errors is usually the limiting factor for high-quality UV/Vis spectrophotometers when the ab- sorbance is relatively small.
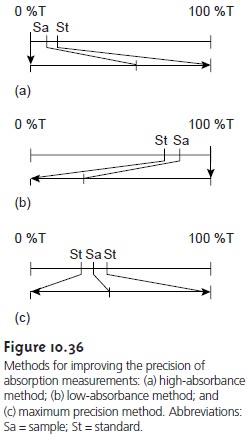
When the relative uncertainty in concentration is limited by the %T readout res- olution, the precision
of the analysis can be improved by redefining the standards
used to define 100% T and
0% T. Normally 100% T is established using a blank,
and 0% T is established while using a shutter to prevent source
radiation from reaching the detector. When the absorbance is too high, precision can be improved
by reset- ting 100% T using a standard solution
of analyte whose concentration is less than that
of the sample
(Figure 10.36a). For
a sample whose
absorbance is too
low, preci- sion can be improved
by redefining 0% T, using a standard solution
of analyte whose concentration is greater than that of the analyte
(Figure 10.36b). In this case a cali- bration curve is required because a linear
relationship between absorbance and con-
centration no longer exists. Precision can be further
increased by combining these two methods (Figure
10.36c). Again, a calibration curve
is necessary because
the rela- tionship between
absorbance and concentration is no longer
linear.
Sensitivity
The sensitivity of a molecular absorption analysis is equivalent to the
slope of a Beer’s-law calibration curve and is determined by the product
of the an- alyte’s absorptivity and the pathlength of the sample
cell. Sensitivity is improved by selecting a wavelength when absorbance is at a maximum or by increasing the pathlength.
Selectivity
Selectivity is rarely a problem in molecular absorption spectrophotom- etry. In many cases it is possible
to find a wavelength at which only the analyte
ab- sorbs or to use chemical
reactions in a manner such that the analyte is the only species that absorbs at the chosen
wavelength. When two or more species con- tribute to the measured
absorbance, a multicomponent analysis is still
possible, as shown in Example 10.6.
Time, Cost, and Equipment
The analysis of a sample
by molecular absorption spec- troscopy is relatively rapid, although additional time may be required when it is nec-
essary to use a chemical
reaction to transform a nonabsorbing analyte
into an ab- sorbing form. The cost of UV/Vis
instrumentation ranges from several hundred
dollars for a simple, manually
operated, single-beam instrument equipped with an inexpensive grating, to as much as $50,000 for
a computer-controlled, high-resolu- tion, double-beam instrument equipped with
variable slits and
operating over an ex-
tended range of wavelengths. Fourier
transform infrared spectrometers can be ob- tained for as little as $15,000–$20,000, although more expensive
models are available.
Related Topics