Chapter: Modern Analytical Chemistry: Spectroscopic Methods of Analysis
Basic Components of Spectroscopic Instrumentation
Basic Components of
Spectroscopic Instrumentation
The instruments used in spectroscopy consist of several common components, including a source of energy that can be input to the sample, a means for isolat- ing a narrow range of wavelengths, a detector for measuring the signal, and a sig- nal processor to display the signal in a form convenient for the analyst. In this section we introduce the basic components used to construct spectroscopic in struments.
Sources of Energy
All forms of spectroscopy require
a source of energy. In absorption and
scattering spectroscopy this energy
is supplied by photons. Emission
and luminescence spec- troscopy use thermal, radiant
(photon), or chemical
energy to promote
the analyte to a less stable,
higher energy state.
Sources of Electromagnetic Radiation
A source of electromagnetic radiation must provide an output that
is both intense
and stable in the desired
region of the
elec- tromagnetic spectrum. Sources
of electromagnetic radiation are classified as either
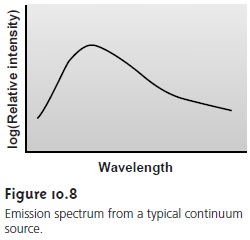
continuum or line sources. A continuum
source emits radiation over a wide
range of wavelengths, with a relatively smooth variation in intensity as a function
of wave- length (Figure
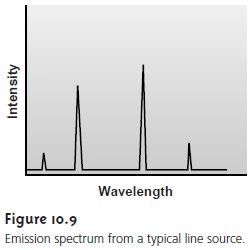
10.8). Line sources, on
the other hand,
emit radiation at a few se-
lected, narrow wavelength ranges (Figure 10.9).
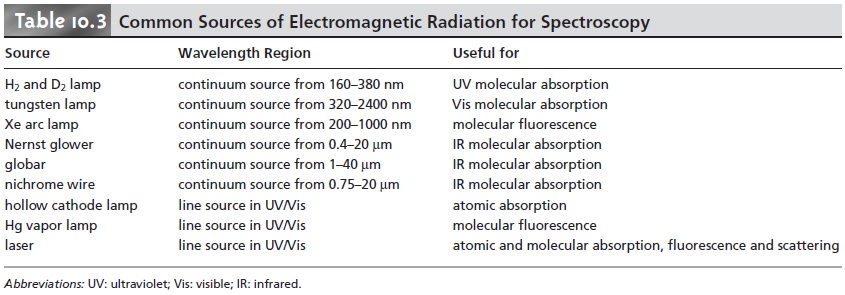
Table 10.3 provides a list of the
most common sources of electromagnetic radiation.
Sources of Thermal Energy
The most
common sources of thermal energy are flames
and plasmas. Flame
sources use the
combustion of a fuel and
an oxidant such as acetylene and
air, to achieve
temperatures of 2000–3400 K. Plasmas, which are hot, ionized gases,
provide temperatures of 6000–10,000 K.
Chemical Sources of Energy
Exothermic reactions also may serve
as a source of energy.
In chemiluminescence the analyte is raised to a higher-energy state by means of a chemical
reaction, emitting characteristic radiation when it returns to a
lower-energy state. When the chemical
reaction results from a biological or enzy- matic reaction, the emission of radiation is called bioluminescence. Commercially available “light sticks”
and the flash
of light from
a firefly are
examples of chemilu- minescence and bioluminescence,
respectively.
Wavelength Selection
In Nessler’s original
colorimetric method for ammonia, no attempt was made to narrow the wavelength range of visible
light passing through the
sample. If more
than one component in the sample
contributes to the absorption of radiation, however, then a quantitative analysis using Nessler’s original method
becomes impossible. For
this reason we usually try
to select a single
wavelength where the analyte is the only absorbing species.
Unfortunately, we can- not
isolate a single
wavelength of radiation from a continuum source. Instead, a wavelength selector passes a narrow band of radiation
(Figure 10.10) characterized by a nominal
wavelength, an effective bandwidth, and a maximum
throughput of radiation. The
effective bandwidth is defined as the width
of the radiation at half the maximum throughput.

The ideal wavelength selector has a high throughput of radiation and a nar- row
effective bandwidth. A high throughput is desirable because
more photons pass through
the wavelength selector, giving a stronger
signal with less back-
ground noise. A narrow effective
bandwidth provides a higher resolution, with spectral features separated by more than twice the effective bandwidth being
resolved. Generally these
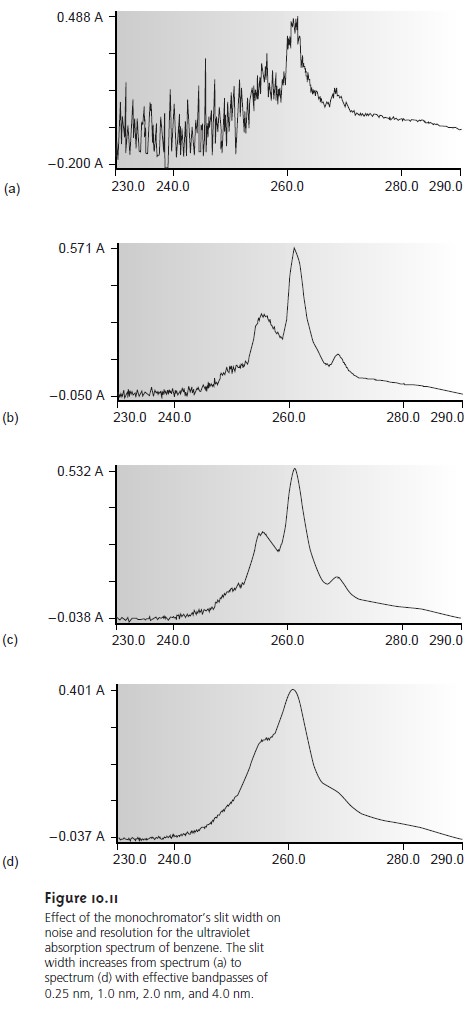
two features of a wavelength selector are in opposition
(Figure 10.11). Conditions favoring a higher
throughput of radiation usually pro- vide
less resolution. Decreasing the effective bandwidth improves resolution, but at the cost of a noisier
signal. For a qualitative analysis,
resolution is generally more important than the
throughput of radiation; thus, smaller effective band- widths are desirable. In a quantitative analysis a higher throughput of radiation is usually desirable.
Wavelength Selection Using Filters
The simplest method
for isolating a narrow
band of radiation is to use an absorption or interference filter.
Absorption filters work by selectively absorbing radiation from a narrow region
of the electromagnetic spectrum. Interference filters
use constructive and destructive interference to isolate a narrow range of wavelengths. A simple example
of an absorption filter is a piece of
colored glass. A purple filter,
for example, removes
the complementary color
green from 500–560 nm. Commercially available absorption filters provide
effective band- widths from 30–250 nm. The maximum
throughput for the smallest effective
band- passes, however, may
be only 10%
of the source’s emission intensity over
that range of wavelengths. Interference filters are more expensive than absorption filters,
but have narrower effective
bandwidths, typically 10–20 nm, with maximum through- puts of at least
40%.
Wavelength Selection Using Monochromators
One limitation of an absorption or interference filter is that they do not allow for a continuous selection of wavelength. If measurements need to be made at two wavelengths, then the filter must bechanged
in between measurements. A further limitation is that filters
are available for only selected nominal
ranges of wavelengths. An alternative approach
to wave- length selection, which provides for a continuous variation of wavelength, is the monochromator.
The construction of a typical monochromator is shown in Figure 10.12. Radia- tion from the source enters the monochromator through an entrance slit. The radi- ation is collected by a collimating mirror, which reflects a parallel beam of radiation to a diffraction grating. The diffraction grating is an optically reflecting surface with a large number of parallel grooves (see inset to Figure 10.12).
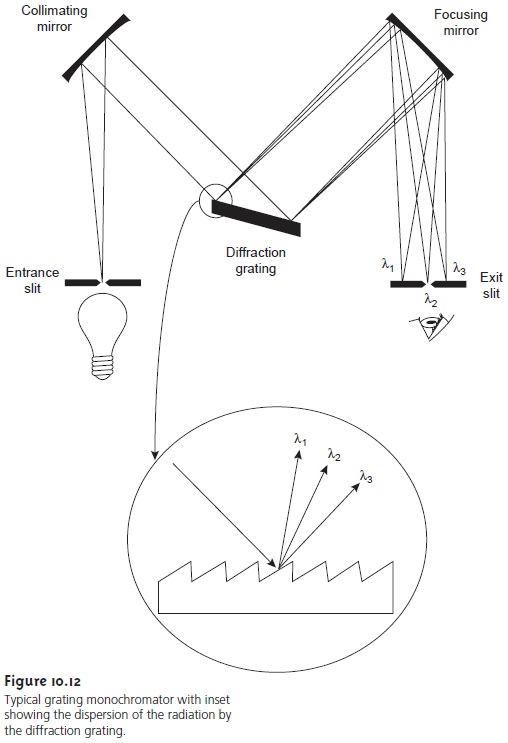
Diffraction by the grating disperses the radiation in space, where
a second mirror
focuses the radiation onto a planar surface
containing an exit
slit. In some
monochromators a prism
is used in place
of the diffraction grating.
Radiation exits the monochromator and passes to the detector. As shown in Figure 10.12, a polychromatic source of radiation at the entrance slit is converted at the exit slit to a monochromatic source of finite effective bandwidth.
The choice of which wavelength exits
the monochromator is determined
by rotating the diffraction
grating. A narrower
exit slit provides a smaller
effective bandwidth and
better reso- lution, but
allows a smaller
throughput of radiation.
Monochromators are classified as ei- ther fixed-wavelength or scanning. In a fixed-wavelength
monochromator, the wavelength is selected
by manually rotating the grating. Normally, a fixed-wavelength
monochromator is only used for quantita-
tive analyses
where measurements are made
at one or two wavelengths. A scan- ning monochromator includes a drive mechanism
that continuously rotates the grating, allowing successive wavelengths
to exit from the monochromator. Scan- ning monochromators are used to acquire
spectra and, when operated in a fixed- wavelength mode, for quantitative analysis.
Interferometers
An interferometer pro- vides an alternative approach for wave- length selection.
Instead of filtering or dispersing the electromagnetic radiation,
an interferometer simultaneously allows source radiation
of all wavelengths to reach the detector (Figure 10.13). Radia-
tion from the
source is focused
on a beam splitter
that transmits half of the radiation
to a fixed mirror, while reflecting
the other half to a movable
mirror. The radia- tion recombines at the beam splitter,
where constructive and destructive inter- ference
determines, for each wavelength, the intensity of light reaching the de- tector.
As the moving mirror changes position, the
wavelengths of light experi- encing maximum constructive interference and maximum destructive
interference also changes. The
signal at the detector shows intensity as a func- tion of the moving mirror’s
position, expressed in units of distance or time. The result is called an interferogram, or a time domain spectrum. The time domain spectrum
is converted mathematically, by
a process called a Fourier transform, to the normal
spectrum (also called a frequency
domain spectrum) of intensity as a function
of the radiation’s energy.

In comparison with a monochromator, interferometers provide two signifi- cant advantages. The first advantage, which is termed Jacquinot’s advantage, re- sults from the higher throughput of source radiation. Since an interferometer does not use slits and has fewer optical components from which radiation can be scattered and lost, the throughput of radiation reaching the detector is 80–200 times greater than that achieved with a monochromator.
The result is an improved signal-to-noise ratio. The second
advantage, which is called Fellgett’s ad- vantage, reflects
a savings in the time needed to obtain a spectrum. Since
all fre- quencies are
monitored simultaneously, an entire spectrum can be recorded in approximately 1 s, as compared
to 10–15 min with a scanning monochromator.
Detectors
The first detector
for optical spectroscopy was the human eye, which, of course,
is limited both by its accuracy
and its limited sensitivity to electromagnetic radiation. Modern detectors use a sensitive transducer to
convert a signal
consisting of pho- tons into an easily
measured electrical signal.
Ideally the detector’s signal, S, should
be a linear function of the electromagnetic radiation’s power, P,
S = kP + D
where k is the detector’s sensitivity, and D is the detector’s dark current, or the background electric current
when all radiation
from the source is blocked
from the detector.
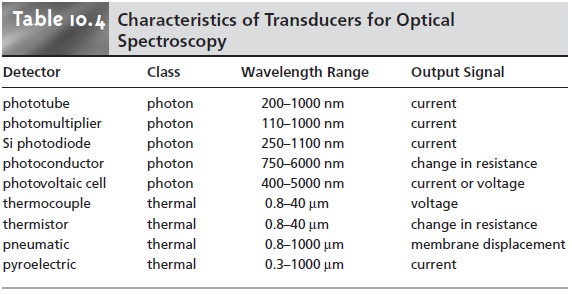
Photon Transducers
Two
general
classes
of
transducers are used for optical
spectroscopy, several examples of which are
listed in Table
10.4. Phototubes and photomultipliers contain
a photosensitive surface
that absorbs radiation in the ultraviolet, visible, and near infrared (IR),
producing an electric
current propor- tional to the number
of photons reaching
the transducer. Other
photon detec- tors use a semiconductor as the photosensitive surface. When the semiconductor
absorbs photons, valence electrons move to the semiconductor’s conduction
band, producing a measurable current.
One advantage of the Si photodiode is that
it is easily miniaturized. Groups
of photodiodes may be gathered
together in a linear
array containing from 64 to 4096 individual photodiodes. With a width
of 25 μm per diode, for example,
a linear array of 2048 photodiodes requires
only 51.2 mm of linear
space. By placing
a photodiode array along
the mono- chromator’s focal
plane, it is possible to monitor simultaneously an entire range of
wavelengths.
Thermal Transducers
Infrared radiation generally does not have sufficient en- ergy to produce a measurable current when using a photon transducer. A thermal transducer, therefore, is used for infrared spectroscopy. The absorption of in- frared photons by a thermal transducer increases its temperature, changing one or more of its characteristic properties.
The pneumatic transducer, for example, consists of a small tube filled with xenon gas equipped with an IR-transparent window at one end,
and a flexible membrane at the other
end. A blackened sur- face in the tube absorbs
photons, increasing the temperature and, therefore, the
pressure of the gas. The greater pressure in the tube causes the flexible
mem- brane to move in and out, and this displacement is monitored
to produce an electrical signal.
Signal Processors
The electrical signal
generated by the transducer is sent to a signal processor where it is displayed in a more convenient form for the analyst. Examples
of signal proces- sors include analog or digital meters,
recorders, and computers equipped with digi- tal acquisition boards. The
signal processor also
may be used
to calibrate the
detec- tor’s response, to amplify the signal from the detector, to remove noise
by filtering, or to mathematically transform
the signal.
Related Topics