Chapter: Modern Analytical Chemistry: Spectroscopic Methods of Analysis
Absorbance of Electromagnetic Radiation - Spectroscopy Based on Absorption
Absorbance of Electromagnetic Radiation
In
absorption spectroscopy a beam of electromagnetic radiation passes through a sam- ple.
Much of the radiation is transmitted without a loss in intensity. At selected
fre- quencies, however, the
radiation’s intensity is attenuated. This process of attenuation is called absorption. Two general requirements must be met if an analyte is to absorb
electromagnetic radiation. The
first requirement is that there
must be a mechanism by
which the radiation’s electric field or magnetic
field interacts with the analyte.
For ul- traviolet and visible radiation, this interaction involves the
electronic energy of valence electrons. A chemical
bond’s vibrational energy is altered
by the absorbance of infrared radiation. A more detailed
treatment of this interaction, and its importance in deter- mining the intensity
of absorption.
The second requirement is that the energy of the electromagnetic radia- tion must exactly
equal the difference in energy, ∆E, between two
of the ana- lytes quantized energy states.
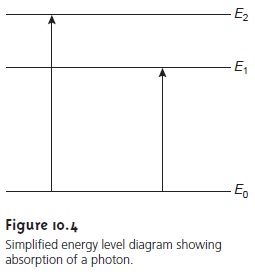
Figure 10.4 shows
a simplified view of the ab-
sorption of a photon. The figure is useful because it emphasizes
that the photon’s energy
must match the difference in energy between
a lower-energy state and a higher-energy state. What is missing, however,
is information about the types of energetic states
involved, which transitions between states are likely
to occur, and the appearance of the resulting spectrum.
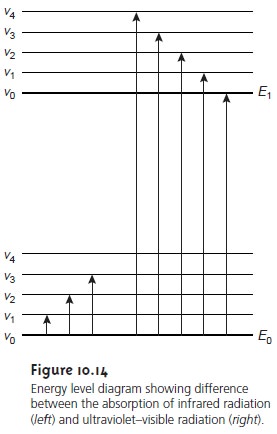
We can use
the energy level
diagram in Figure
10.14 to explain
an ab- sorbance spectrum. The thick lines
labeled E0 and E1 represent the analyte’s ground (lowest)
electronic state and its first electronic excited
state. Superim- posed on each electronic energy level is a series
of lines representing vibra- tional energy levels.
Infrared Spectra for Molecules and Polyatomic Ions
The energy of infrared
radiation is sufficient to produce
a change in the vibrational energy of a mole-
cule or polyatomic ion (see Table 10.1).
As shown in Figure 10.14,
vibrational energy levels are
quantized; that is,
a molecule may
have only certain, discrete vibrational energies. The
energy for allowed
vibrational modes, Ev, is
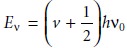
where v is the
vibrational quantum number, which may take values of 0, 1, 2,
. . ., and v0 is the bond’s
fundamental vibrational frequency. Values for v0 are determined by the
bond’s strength and
the mass at each end
of the bond and are characteristic of the type of bond. For example,
a carbon–carbon sin- gle bond (C—C) absorbs infrared radiation at a lower energy than a
carbon–carbon double bond (C=C)
because aC—C bond is weaker
than a C=C bond.
At room temperature most molecules are
in their ground vibrational state (v = 0). A transi- tion from the ground vibrational state to the first vibrational excited state (v =
1) requires the absorption of a photon
with an energy
of hv0. Transitions in which ∆v is 1 give rise to the fundamental absorption lines. Weaker
absorp- tion lines, called overtones, are due to transi-
tions in which ∆v is ±2 or ±3. The number of possible normal
vibrational modes for a linear
molecule is 3N – 5, and for
a nonlinear mole- cule
is 3N – 6, where N is
the number of atoms
in the molecule. Not surprisingly, infrared spec- tra often show a considerable number of ab- sorption bands. Even a relatively simple mole-
cule, such as benzene (C6H6), for example, has 30 possible normal modes of
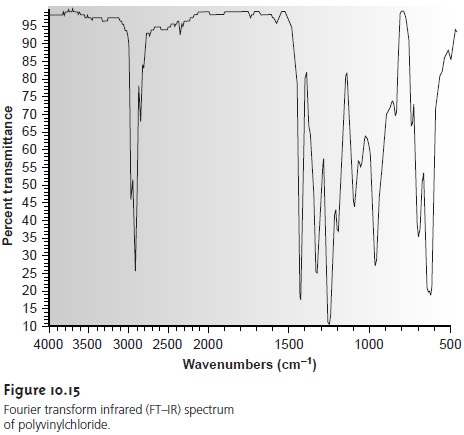
vibration, al- though not all of these vibrational modes give rise to an absorption. A typical IR spectrum is shown
in Figure 10.15.
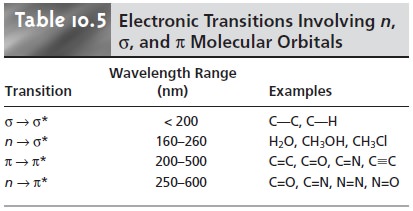
UV/Vis Spectra for Molecules and Ions
When a molecule
or ion absorbs ultravio-
let or visible radiation it undergoes a change in its valence
electron configuration. The valence
electrons in organic
molecules, and inorganic anions such as CO32–,
oc- cupy quantized sigma bonding, σ, pi bonding,
π, and nonbonding, n, molecular or- bitals. Unoccupied sigma antibonding, σ*, and pi antibonding, π*, molecular or- bitals often lie close
enough in energy
that the transition of an electron
from an occupied to an unoccupied orbital is possible.
|
3 |
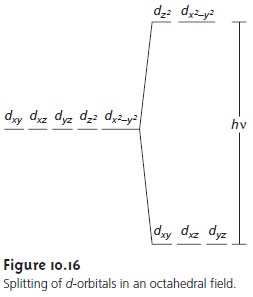
Many transition metal
ions, such as Cu2+ and Co2+, form solutions that are colored because the metal
ion absorbs visible
light. The transitions giving rise to this
absorption are due to valence
electrons in the metal ion’s d-orbitals. For a free metal ion, the five d-orbitals are of equal energy. In the presence
of a com- plexing ligand or solvent molecule, however, the d-orbitals split into two or
more groups that differ in energy.
For example, in the octahedral complex
Cu(H2O)62+ the six water molecules perturb the d-orbitals
into two groups as shown
in Figure 10.16.
The resulting d–d transitions for transition metal
ions are relatively weak.
A more important source of UV/Vis
absorption for inorganic metal–ligand complexes is charge
transfer, in which
absorbing a photon
produces an excited
state species that can be described in terms of the transfer
of an electron from the metal,
M, to the ligand, L.
M—L
+ hv → M+—L–
Charge-transfer absorption is important because
it produces very large absorbances, providing for a much more sensitive analytical method. One important example
of a charge-transfer complex
is that of o-phenanthroline with Fe2+, the UV/Vis spec- trum for which is shown in Figure 10.17.
Charge-transfer absorption in which the electron moves from the ligand to the metal
also is possible.
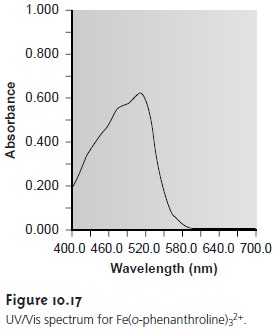
Comparing the IR spectrum in Figure 10.15 to the UV/Vis spectrum in Figure 10.17, we note that UV/Vis absorption bands are often significantly broader than those for IR absorption. Figure 10.14 shows why this is true.
When a species absorbs
UV/Vis
radiation, the transition
between electronic energy levels may also include
a transition between
vibrational energy levels.
The result is a num- ber of closely spaced absorption bands that merge together to form a single broad absorption band.
UV/Vis Spectra for Atoms
As noted in Table 10.1, the energy
of ultra- violet and visible
electromagnetic radiation is sufficient to cause a change in an atom’s valence electron configuration. Sodium, for exam- ple, with a valence
shell electron configuration of [Ne] 3s1, has a single valence electron in its 3s atomic orbital. Unoccupied, higher energy atomic orbitals also exist. Figure 10.18 shows a partial
energy level dia-
gram for sodium’s occupied and unoccupied valence shell atomic or-
bitals. This configuration of atomic
orbitals, which shows a splitting
of the p orbitals into two levels with slightly
different energies, may differ from that encountered in earlier
courses. The reasons
for this splitting, however, are beyond the level of this text,
and unimportant in this
context.
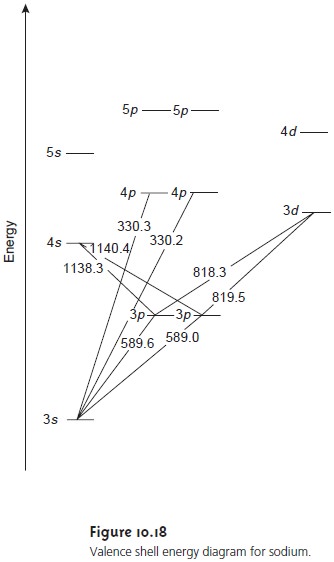
Absorption of a photon is accompanied by the excitation of an electron from a lower-energy atomic orbital to an orbital
of higher energy. Not all possible
transitions between atomic
orbitals are al- lowed.
For sodium the
only allowed transitions are those in which
there is a change of ±1 in the orbital quantum number (l);
thus transitions from s→p orbitals
are allowed, but transitions from s→d orbitals are forbidden. The wavelengths of electromagnetic ra- diation that
must be absorbed to cause several
allowed transitions are shown in Figure 10.18.
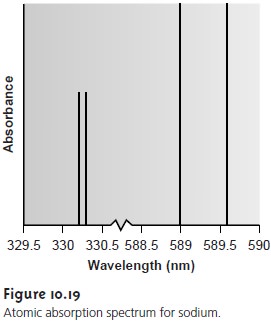
The atomic absorption spectrum for Na is shown in Figure 10.19 and is typical of that found
for most atoms.
The most obvi- ous feature of this
spectrum is that
it consists of a few,
discrete ab- sorption lines corresponding to transitions between the ground
state (the 3s atomic orbital) and the
3p and 4p atomic orbitals. Ab- sorption from excited states,
such as that from the 3p atomic or
bital to the 4s or 3d atomic orbital, which are
included in the
en- ergy level
diagram in Figure
10.18, are too weak to detect. Since
the lifetime of an excited state
is short, typically 10–7–10–8 s, an atom in the ex- cited state
is likely to return to the ground
state before it has an opportu-
nity to absorb a photon.
Another feature of the spectrum
shown in Figure
10.19 is the narrow
width of the absorption lines,
which is a consequence of the fixed
difference in energy between
the ground and excited states.
Natural line widths for atomic
absorption, which are governed by the uncertainty principle, are ap- proximately 10–5 nm. Other
contributions to broadening increase this line width to approximately 10–3 nm.
Related Topics