Chapter: Modern Analytical Chemistry: Chromatographic and Electrophoretic Methods
General Theory of Column Chromatography
General Theory of
Column Chromatography
Of the two
methods for bringing
the stationary and mobile phases into contact,
the more important is column chromatography. In this section we develop a general theory that we may apply to any form of column chromatogra-
phy. With appropriate modifications, this theory also can be applied to planar chromatography.
A typical column chromatography experiment is outlined in Figure 12.4. Al- though the figure depicts a liquid–solid chromatographic experiment similar to that first used by Tswett, the design of the column and the physical state of the stationary and mobile phases may vary.
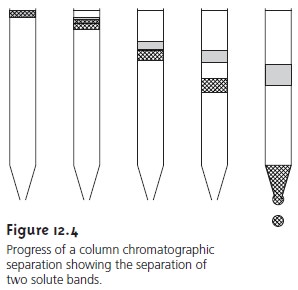
The sample is introduced at the top
of the column as a narrow
band. Ideally, the
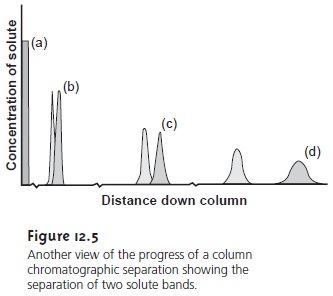
solute’s initial concentration profile is rec- tangular (Figure 12.5a). As the sample
moves down the
column the solutes
begin to separate, and the individual solute bands begin to broaden and develop a Gaussian profile (Figures 12.5b,c).
If the strength of each solute’s interaction with the stationary phase is sufficiently different, then the solutes separate
into individ- ual bands
(Figure 12.5d). The
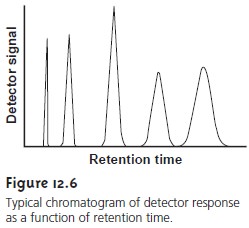
progress of a chromatographic separation is moni- tored with a suitable
detector situated at the end of the column. A plot of the de- tector’s signal as a function of time or volume of eluted mobile
phase is known
as a chromatogram (Figure 12.6)
and consists of a peak
for each of the separated solute bands.
A chromatographic peak may be characterized in many ways,
two of which are shown in Figure 12.7.
The retention time, tr, is the elapsed
time from the
introduc- tion of the solute to the peak maximum. The retention time also can be measured indirectly as the volume of mobile phase eluting
between the solute’s
introduction and the appearance of the solute’s peak maximum. This
is known as the retention
volume, Vr. Dividing the
retention volume by the mobile
phase’s flow rate,
u, gives the retention time.
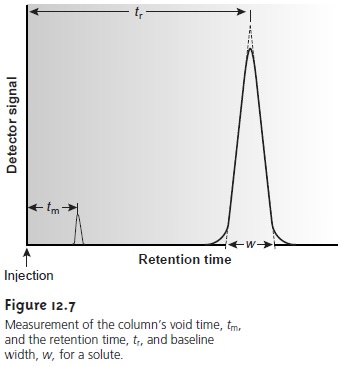
The second important parameter is the chromatographic peak’s width at the baseline, w. As shown in Figure 12.7, baseline width is determined by the inter- section with the baseline of tangent lines drawn through the inflection points on either side of the chromatographic peak. Baseline width is measured in units of time or volume, depending on whether the retention time or retention volume is of interest.
Besides the solute
peak, Figure 12.7 also shows
a small peak eluted soon after
the sample is injected into the mobile
phase. This peak results from solutes that move through the column at the same rate as the mobile phase. Since these solutes
do not interact with the stationary phase,
they are considered nonretained. The
time or volume of mobile phase required
to elute nonretained components is called the column’s void time, tm, or void volume.
Related Topics