Chapter: Modern Analytical Chemistry: Chromatographic and Electrophoretic Methods
Gas Chromatography: Quantitative Applications
Quantitative Applications
Gas chromatography is widely used for the analysis of a diverse
array of samples
in environmental, clinical, pharmaceutical, biochemical, forensic, food
science, and petrochemical laboratories. Examples
of these applications are discussed in the fol- lowing sections.
Environmental Analysis
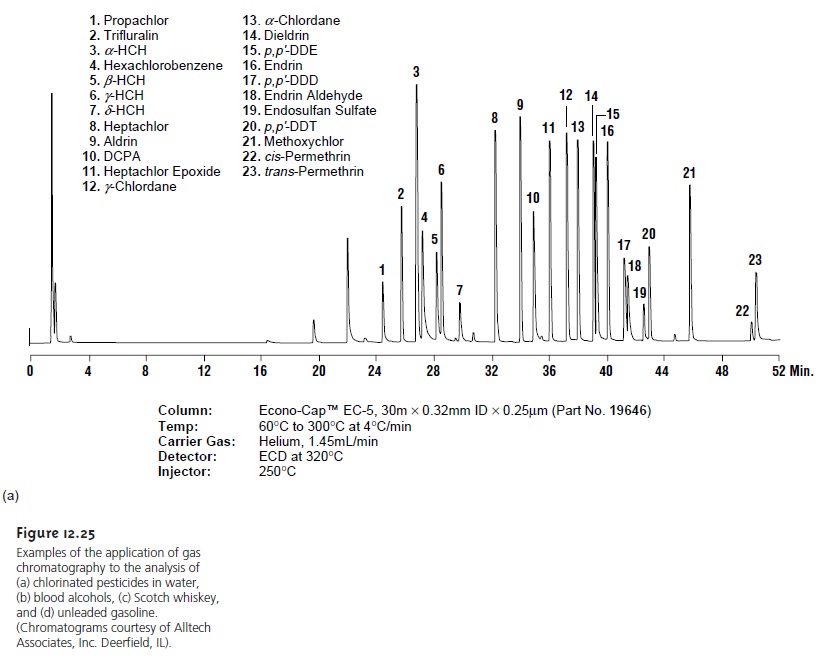
One of the most important environmental applications of gas chromatography is for the analysis of numerous organic pollutants in air, water, and wastewater. The analysis of volatile organics in drinking water, for example, is accomplished by a purge and trap, followed by their separation on a capillary col- umn with a nonpolar stationary phase. A flame ionization, electron capture, or mass spectrometer can be used as a detector. Figure 12.25a shows a typical chro- matogram for the analysis of chlorinated pesticides in water.

Clinical Analysis
Clinical, pharmaceutical, and forensic labs make frequent
use of gas chromatography for the analysis
of drugs. Because
the sample’s matrix
is often incompatible with
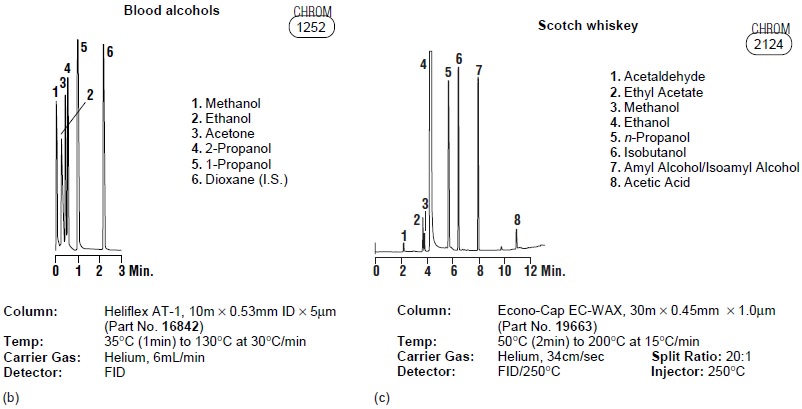
the GC column, analytes generally must be isolated by extrac- tion. Figure
12.25b shows how gas chromatography can be used in monitoring blood alcohol levels.
Consumer Goods
Many flavors, spices,
and fragrances are
readily analyzed by GC,
using headspace analysis or thermal desorption. Foods and beverages are analyzed
either directly or following a suitable extraction. Volatile materials, such as those found in spices and fragrances, often can be obtained by headspace sampling.
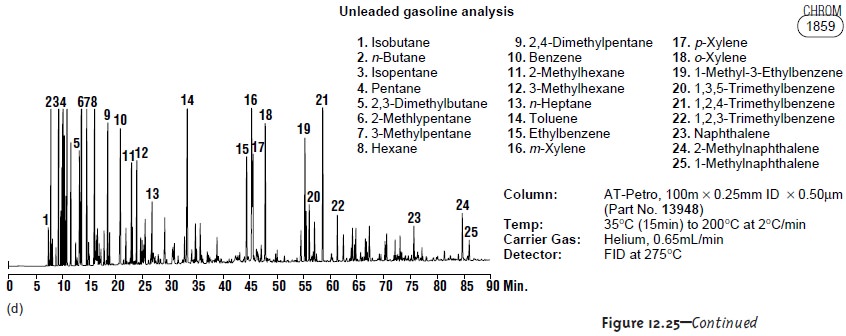
Fig- ure 12.25c shows
a typical analysis of a sample
of Scotch whiskey.


Petroleum Industry
Gas chromatography is ideally suited for the analysis of petro-
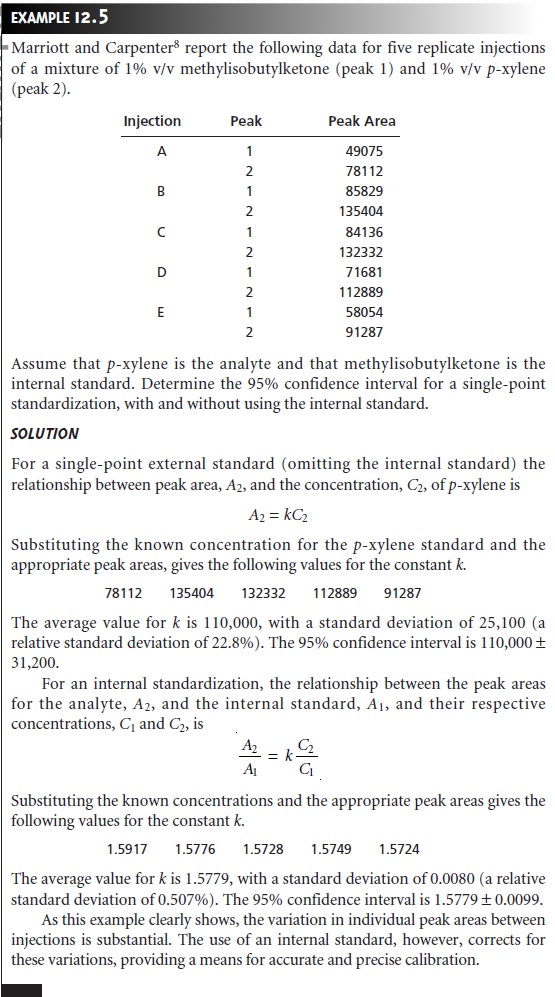
leum products, including gasoline, diesel fuel, and oil. A typical chromatogram for the analysis of unleaded gasoline
is shown in Figure 12.25d.
Quantitative Calculations
In a quantitative analysis, the height or area of an ana- lyte’s chromatographic peak is used to determine its concentration. Although peak height is easy to measure, its utility is limited by the inverse relationship between the height and width of a chromatographic peak.
Unless chromatographic conditions are carefully controlled to maintain a constant column efficiency, variations in peak height may decrease the accuracy and precision of the quantitative analysis. A better choice
is to measure the area under the chromatographic peak with an inte-
grating recorder. Since
peak area is directly proportional to the amount
of analyte that was injected, changes
in column efficiency will not affect
the accuracy or preci-
sion of the analysis.
Calibration curves are usually constructed by analyzing a series of external
standards and plotting the detector’s signal
as a function of their
known concentra- tions. As long as the injection volume is identical for every standard
and sample, calibration curves prepared in this fashion
give both accurate
and precise results. Unfortunately, even under the best of conditions, replicate
injections may have vol-
umes that differ by as much as 5% and often may be substantially worse. For this reason, quantitative work requiring
high accuracy and precision is accomplished using an internal standard.

Related Topics