Chapter: Modern Analytical Chemistry: Chromatographic and Electrophoretic Methods
Gas Chromatography: Detectors for Gas Chromatography
Detectors for Gas Chromatography
The final part of a gas chromatograph is the detector. The ideal detector
has several desirable features, including low detection limits, a linear
response over a wide range of solute concentrations (which makes quantitative work easier), responsive- ness to all solutes
or selectivity for a specific
class of solutes,
and an insensitivity to
changes in flow rate or temperature.
Thermal Conductivity Detector
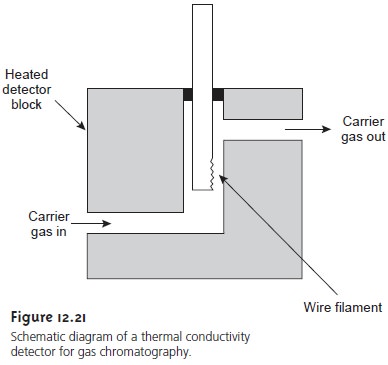
One of the earliest gas chromatography detectors, which is still widely used, is based on the mobile phase’s
thermal conductivity (Figure
12.21). As the
mobile phase exits
the column, it passes over
a tungsten–rhenium wire filament.
The filament’s electrical resistance depends on its temperature, which, in turn, depends
on the thermal conductivity of the mobile phase. Because of its high thermal
conductivity, helium is the mobile phase of choice when using a thermal
conductivity detector (TCD).

When a solute
elutes from the
column, the thermal
conductivity of the
mobile phase decreases and
the temperature of the wire
filament, and thus
its resistance, in- creases. A reference cell, through which only the mobile phase passes, corrects
for any time-dependent variations in flow rate, pressure, or electrical power, all of which
may lead to a change
in the filament’s resistance.
A TCD detector has the advantage of universality, since it gives a signal for any solute whose thermal conductivity differs from that of helium. Another ad- vantage is that it gives a linear response for solute concentrations over a range of 104–105 orders of magnitude. The detector also is nondestructive, making it pos- sible to isolate solutes with a postdetector cold trap. Unfortunately, the thermal conductivity detector’s detection limit is poor in comparison with other popular detectors.
Flame Ionization Detector
Combustion of an organic compound in an H2/air flame results
in a flame rich in electrons and ions. If a po- tential of approximately 300 V is applied across
the flame, a small cur- rent of roughly 10–9–10–12 A develops. When amplified, this current
provides a useful analytical
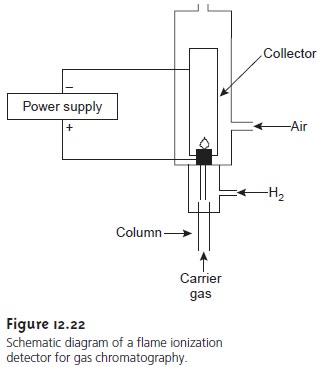
signal. This is the basis of the popular
flame ionization detector (FID), a schematic
of which is shown in Figure 12.22.

Most
carbon
atoms,
except
those
in
carbonyl
and
carboxylic groups, generate
a signal, making the FID an almost universal detector for organic compounds. Most
inorganic compounds and many gases, such as H2O and CO2, cannot
be detected, making
the FID detector ideal for the analysis
of atmospheric and aqueous environmental sam- ples. Advantages of the FID
include a detection limit that is approximately two to three orders of magnitude smaller
than that for a thermal
conductiv- ity detector and a linear
response over 106–107 orders of magnitude in the amount of analyte injected. The sample, of course, is destroyed when using a flame ioniza- tion detector.
Electron Capture Detector
The electron capture
detector is an example of a selec- tive detector. The detector
consists of a beta emitter
(a beta particle
is an electron) such as 63Ni.
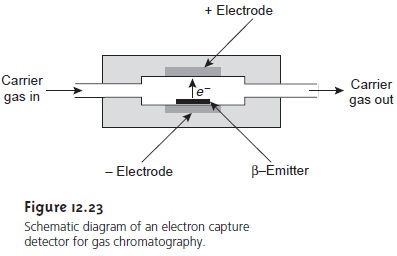
The emitted electrons ionize the mobile
phase, which is usually N2, re- sulting in the production of additional electrons
that give rise to an electric current between a pair of electrodes (Figure
12.23). When a solute with a high cross section for the capture of electrons elutes
from the column,
the electric current
decreases. This decrease in electric current
serves as the signal. The ECD is highly selective to- ward solutes with electronegative functional groups, such
as halogens, and nitro groups and is relatively insensitive to amines, alcohols, and hydrocarbons. Although its detection limit is excellent, its linear range extends over only about two orders of
magnitude.

Other Detectors
Two additional detectors are similar in design to a flame
ioniza- tion detector. In the flame
photometric detector optical
emission from phospho- rus and sulfur provides a detector selective for compounds containing these ele- ments. The thermionic detector
responds to compounds containing nitrogen or phosphorus.
Two common detectors, which also are independent instruments, are Fourier transform infrared spectrophotometers (FT–IR) and mass spectrometers (MS). In GC–FT–IR, effluent from the column flows through an optical cell constructed from a 10–40-cm Pyrex tube with an internal diameter of 1–3 mm. The cell’s interior surface is coated with a reflecting layer of gold. Multiple reflections of the source radiation as it is transmitted through the cell increase the optical path length through the sample.
In GC–MS effluent
from the column
is introduced directly
into the mass spec-
trometer’s ionization chamber
in a manner that eliminates the majority of the car- rier
gas. In the
ionization chamber all
molecules (remaining carrier
gas, solvent, and solutes) are ionized, and the ions are separated
by their mass-to-charge ratio. Be- cause each
solute undergoes a characteristic fragmentation into smaller ions, its mass spectrum of
ion intensity as a function of mass-to-charge ratio
provides qual- itative information that can be used to identify the solute.

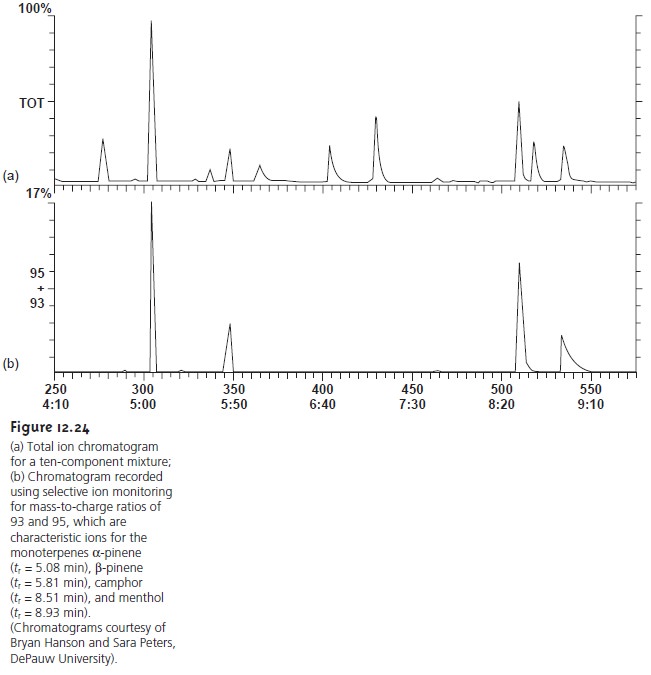
As a GC detector, the total ion current for all ions reaching the detector is usu-
ally used to obtain the chromatogram (Figure
12.24a). Selectivity can be achieved by monitoring only specific
mass-to-charge ratios (Figure
12.24b), a process
called selective ion monitoring. A mass spectrometer provides excellent
detection limits, typically 25 fg to 100 pg,
with a linear
range spanning five
orders of magnitude.
Related Topics