Chapter: Embedded Systems
Embedded System Development Tools
EMBEDDED SYSTEM DEVELOPMENT TOOLS
Emulators,
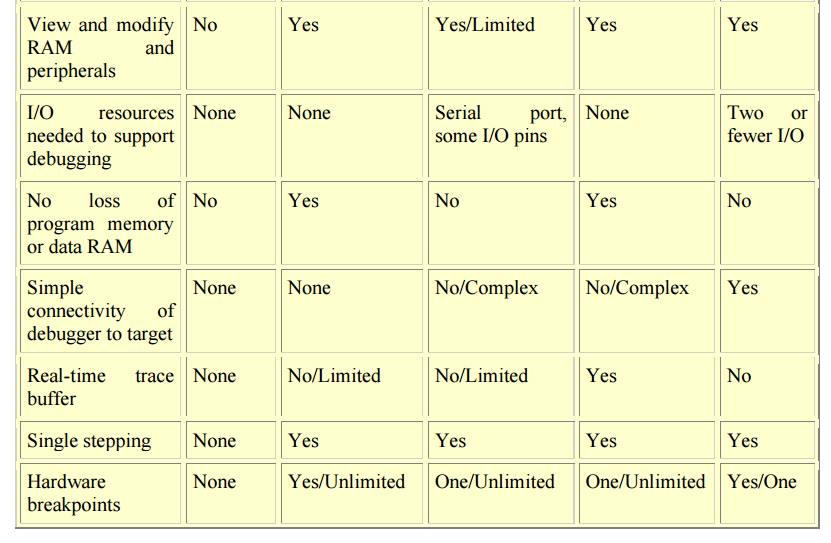
simulators, and in-circuit debuggers have features useful to the design
engineer (see table).
Features of emulators, simulators, and in-circuit
debuggers
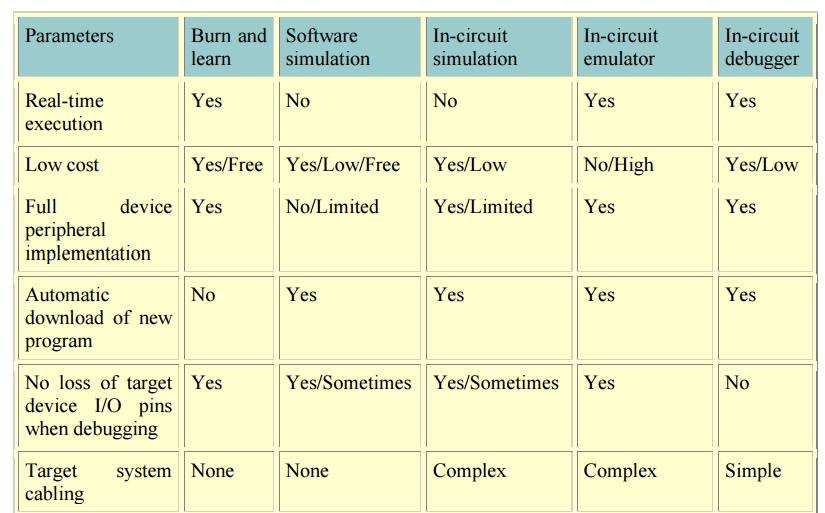
With the
basic run-time features of single-step, full-speed execution and watching
variables, an in-circuit debugger can help in a lot of designs where only an
emulator would have done before. Investing in the right development tools up
front will pay back handsomely in faster development and debug cycles and a
shorter time to market.
DEBUGGING
Debugging is a methodical process of
finding and reducing the number of bugs, or
defects, in a computer program or a piece of electronic hardware, thus
making it behave as expected. Debugging tends to be harder when various
subsystems are tightly coupled, as changes in one may cause bugs to emerge in
another. Many books have been written about debugging (see below: Further
reading), as it involves numerous aspects, including interactive debugging,
control flow, integration testing, log files, monitoring (application, system),
memory dumps, profiling, Statistical Process Control, and special design
tactics to improve detection while simplifying changes.
ORIGIN
There is
some controversy over the origin of the term "debugging".
The terms
"bug" and "debugging" are both popularly attributed to
Admiral Grace Hopper in the 1940s. While she was working on a Mark II Computer
at Harvard University, her associates discovered a moth stuck in a relay and
thereby impeding operation, whereupon she remarked that they were
"debugging" the system. However the term "bug" in the
meaning of technical error dates back at least to 1878 and Thomas Edison (see
software bug for a full discussion), and "debugging" seems to have
been used as a term in aeronautics before entering the world of computers.
Indeed, in an interview Grace Hopper remarked that she was not coining the
term. The moth fit the already existing terminology, so it was saved.
The
Oxford English Dictionary entry for "debug" quotes the term
"debugging" used in reference to airplane engine testing in a 1945
article in the Journal of the Royal Aeronautical Society. An article in
"Airforce" (June 1945 p. 50) also refers to debugging, this time of
aircraft cameras. Hopper's bug was found on September 9, 1947. The term was not
adopted by computer programmers until the early 1950s. The seminal article by
Gill in 1951 is the earliest in-depth discussion of programming errors, but it
does not use the term "bug" or "debugging". In the ACM's
digital library, the term "debugging" is first used in three papers
from 1952 ACM National Meetings. Two of the three use the term in quotation
marks. By 1963, "debugging" was a common enough term to be mentioned
in passing without explanation on page 1 of the CTSS manual
SCOPE
As
software and electronic systems have become generally more complex, the various
common debugging techniques have expanded with more methods to detect
anomalies, assess impact, and schedule software patches or full updates to a
system. The words "anomaly" and "discrepancy" can be used,
as being more neutral terms, to avoid the words "error" and
"defect" or "bug" where there might be an implication tha t
all so-called errors, defects or bugs must be fixed (at all costs). Instead, an impact assessment
can be made to determine if changes to remov e an anomaly (or discrepancy)
would be cost-effective for the system, or perhaps a scheduled new release
might render the change(s)
unnecessary. Not all issues are life-critical or mission-critical in a system.
Also, it is important to avoid t he situation where a change might be more u
psetting to users, long-term, than living with the known problem(s) (where the
"cure would b e worse than the disease"). Basing decisions of the
acceptability of some anomalies can avoid a culture of a
"zero-defects" mandate, where people might be tempted to deny the
existence of problems so that the result would appear as zero defects. Considering the collateral
issues, such as the cost-versus-benefit impact assessment, then broader debugging
techniques will expand to determine the frequency of anomalies (how often the
same "bugs" occur) to help assess their impact to the overall system.
TOOLS
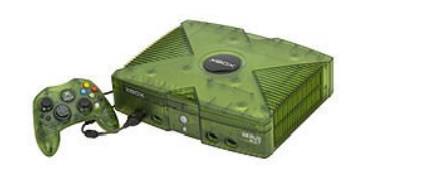
Debugging
on video game con soles is usually done with special hardware su ch as this
Xbox debug unit intended only for developers.
Debugging
ranges, in complexity, from fixing simple errors to performing lengthy and
tiresome tasks of data collection, analysis, and scheduling updates. The
debugging skill o f the programmer can be a major factor in the ability to
debug a problem, but the difficulty of sof tware debugging varies greatly with
the comple xity of the system, and also depends, to som e extent, on the
programming language(s) used and the available tools, such as debuggers. Debuggers are software tools
which enable th e programmer to monitor the execution of a program, stop it,
restart it, set breakpoints, and change values in memory. The term debugger ca n also refer to the person
who is doing the debugging.
Generally,
high-level programm ing languages, such as Java, make debuggin g easier,
because they have features such as excep tion handling that make real sources
of erratic behaviour easier to spot. In programming languag es such as C or
assembly, bugs may cause silent problems such as memory corruption, and it is o
ften difficult to see where the initial problem h appened. In those cases,
memory debugger tools may be needed.
In
certain situations, general pu rpose software tools that are language specific
in nature can be very useful. These take the form of static code analysis tools. These tools look f or a very specific
set of known problems, some common and some rare, within the source code. All
such issues detected by these tools would rarely be picked up by a compiler or
interpreter, thus they are not syntax checkers, but more semantic checkers.
Some tools claim to be able to detect 300+ unique problems. Both commercial and
free tools exist in various languages. These tools can be extremely useful when
checking very large source trees, where it is impractical to do code
walkthroughs. A typical example of a problem detected would be a variable
dereference that occurs before the
variable is assigned a value. Another example would be to perform strong type
checking when the language does not require such. Thus, they are better at
locating likely errors, versus actual errors. As a result, these tools have a
reputation of false positives. The old Unix lint
program is an early example.
For
debugging electronic hardware (e.g., computer hardware) as well as low-level
software (e.g., BIOSes, device drivers) and firmware, instruments such as
oscilloscopes, logic analyzers or in-circuit emulators (ICEs) are often used,
alone or in combination. An ICE may perform many of the typical software
debugger's tasks on low-level software and firmware.
TYPICAL DEBUGGING PROCESS
Normally
the first step in debugging is to attempt to reproduce the problem. This can be
a non-trivial task, for example as with parallel processes or some unusual
software bugs. Also, specific user environment and usage history can make it
difficult to reproduce the problem.
After the
bug is reproduced, the input of the program may need to be simplified to make
it easier to debug. For example, a bug in a compiler can make it crash when
parsing some large source file. However, after simplification of the test case,
only few lines from the original source file can be sufficient to reproduce the
same crash. Such simplification can be made manually, using a divide-and-conquer
approach. The programmer will try to remove some parts of original test case
and check if the problem still exists. When debugging the problem in a GUI, the
programmer can try to skip some user interaction from the original problem
description and check if remaining actions are sufficient for bugs to appear.
After the
test case is sufficiently simplified, a programmer can use a debugger tool to
examine program states (values of variables, plus the call stack) and track
down the origin of the problem(s). Alternatively, tracing can be used. In
simple cases, tracing is just a few print statements, which output the values
of variables at certain points of program execution.
TECHNIQUES
Print debugging (or tracing) is the act of
watching (live or recorded) trace statements, or print statements, that indicate the flow of execution of a
process. This is sometimes called printf
debugging, due to the use of the printf statement in C. This kind of
debugging was turned on by the
command TRON in the original versions of the novice-oriented BASIC programming
language. TRON stood for, "Trace On." TRON caused the line numbers of
each BASIC command line to print as the program ran.
Remote debugging is the process of debugging a
program running on a system different than
the debugger. To start remote debugging, a debugger connects to a remote system
over a network. The debugger can then control the execution of the program on
the remote system and retrieve information about its state.
Post-mortem debugging is debugging
of the program after it has already crashed. Related techniques often include various tracing techniques and/or
analysis of memory dump (or core dump) of the crashed process. The dump of the
process could be obtained automatically by the system (for example, when
process has terminated due to an unhandled exception), or by a
programmer-inserted instruction, or manually by the interactive user.
"Wolf fence" algorithm: Edward
Gauss described this simple but very useful and now famous algorithm in a 1982 article for communications of the ACM
as follows: "There's one wolf in Alaska, how do you find it? First build a
fence down the middle of the state, wait for the wolf to howl, determine which
side of the fence it is on. Repeat process on that side only, until you get to
the point where you can see the wolf." This is implemented e.g. in the Git
version control system as the command git
bisect, which uses the above algorithm to determine which commit introduced
a particular bug.
Delta Debugging -
technique of automating test case simplification.:p.123
Saff Squeeze - technique of isolating failure
within the test using progressive inlining of parts of the failing test.
DEBUGGING FOR EMBEDDED SYSTEMS
In
contrast to the general purpose computer software design environment, a primary
characteristic of embedded environments is the sheer number of different
platforms available to the developers (CPU architectures, vendors, operating
systems and their variants). Embedded systems are, by definition, not general-purpose
designs: they are typically developed for a single task (or small range of
tasks), and the platform is chosen specifically to optimize that application.
Not only does this fact make life tough for embedded system developers, it also
makes debugging and testing of these systems harder as well, since different
debugging tools are needed in different platforms.
to
identify and fix bugs in the system (e.g. logical or synchronization problems
in the code, or a design error in the hardware);
to
collect information about the operating states of the system that may then be
used to analyze the system: to find ways to boost its performance or to
optimize other important characteristics (e.g. energy consumption, reliability,
real-time response etc.).
DEBUGGING TECHNIQUES
n Introduction
n Rule of
Thumb: Write good, bug-free code from start if you could
n Testing/Debugging
embedded software is more difficult than application software
n Post-shipment
application problems are more tolerable than embedded (real-time or
life-critical) software
n 10.1
Testing on Host Machine
n Some reasons why you can’t test (much, if any) on
target machine:
n Test
early (target may not ready or completely stable)
n Exercise
all code, including exceptions (real situations may be difficult to exercise)
n Develop
reusable, repeatable test (difficult to do in target environment, and
likelihood of hitting the same bug is low)
n Store
test results (target may not even have disk drive to store results)
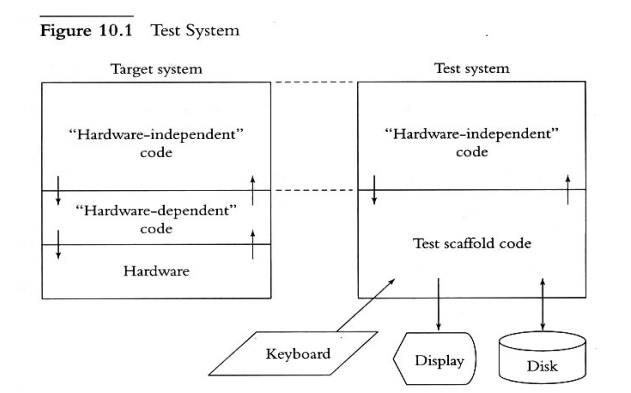
n Target
system on the left: (hardware-indep code, hardware-dep code, hw)
n Test
system (on host) on the right: (hardware-indep code – same, scaffold – rest)
n Scaffold
provides (in software) all functionalities and calls to hardware as in the
hardware-dep and hardware components of the target system – more like a
simulator for them!
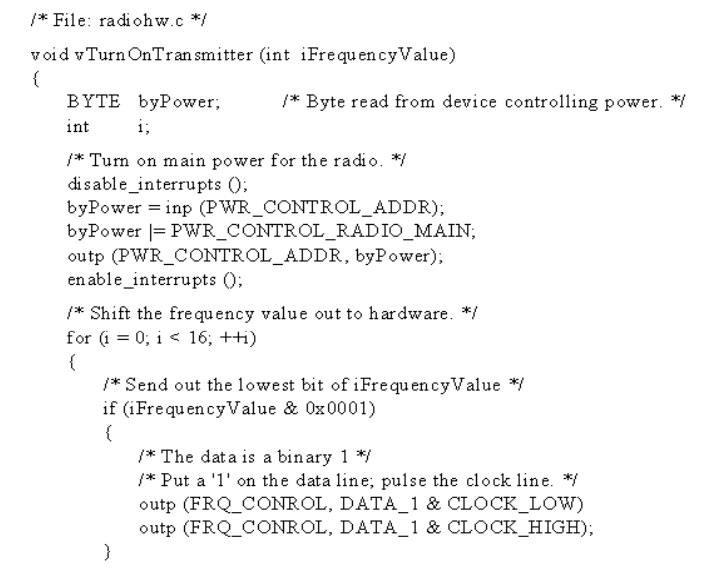
n Radio.c
-- hardware independent code
n Radiohw.c
– hardware dependent code (only interface to hw: inp() and outp() supporting
vTurnOnTransmitter() and vTurnOffTransmitter() functions
n Inp() and
outp() must have real hardware code to read/write byte data correctly - makes
testing harder!!
n Replace
radiohw.c with scaffold, eliminating the need for inp() and outp()
– both
are simulated in software – a program stub!!
Figure 10.2 A Poor
Plan for Testing
/* File:
radio.c */
void
vRadioTask (void)
{
..
.
!! Complicated code to determine if turning on the
radio now
!! is within FCC regulations.
..
.
!! More complicated code to decide if turning on the
radio now
!! makes sense in our protocol.
If (!! Time to send something on the radio)
{
vTurnOnTransmitter
(FREQ_NORMAL);
!! Send data out vTurnOffRadio
();
}
}
n Embedded
systems are interrupt-driven, so to test based on interrupts
n 1) Divide
interrupt routines into two components
n A) a
component that deals with the hardware
n B) a
component of the routine which deals with the rest of the system
n 2) To
test, structure the routine such that the hardware-dependent component (A)
calls the hardware-independent part (B).
n 3) Write
component B in C-language, so that the test scaffold can call it
n Hw
component (A) is vHandleRxHardware(), which reads characters from the hw
n Sw
component (B) is vHandleByte, called by A to buffer characters, among others
n The test
scaffold, vTestMain(), then calls vHandleByte(), to test if the system works
[where vTestMain() pretends to be the hardware sending the chars to
vHandleByte()]
n Calling the Timer Interrupt Routine
n Design
the test scaffold routine to directly call the timer interrupt routine, rather
than other part of the host environment, to avoid interruptions in the
scaffold’s timing of events
n This way,
the scaffold has control over sequences of events in the test which must occur
within intervals of timer interrupts
n Script
Files and Output Files
n To let
the scaffold test the system in some sequence or repeated times, write a script
file (of commands and parameters) to control the test
n Parse the
script file, test system based on commands/parameters, and direct output
–
intermixture of the input-script and output lines – into an output file
n More Advanced Techniques
n Making
the scaffold automatically control sequence of events – e.g., calling the
printer interrupt many times but in a controlled order to avoid swamping
n Making
the scaffold automatically queue up requests-to-send output lines, by
automatically controlling the button interrupt routine, which will cause
successive pressing of a button to let the next output line be received from
the hardware (the printer interrupt routine). In this way, the hardware-independent
software is controlled by the scaffold, where the button interrupts serve as a
switch
n The
scaffold may contain multiple instances of the software-independent code, and
the scaffold serves as a controller of the communication between the instances
– where each instance is called by the scaffold when the hardware interrupt
occurs (e.g., the scanner or the cash register). In this way, the scaffold
simulates the hardware (scanner or register) and provides communication
services to the software-independent code instances it calls. – See Fig 10.7
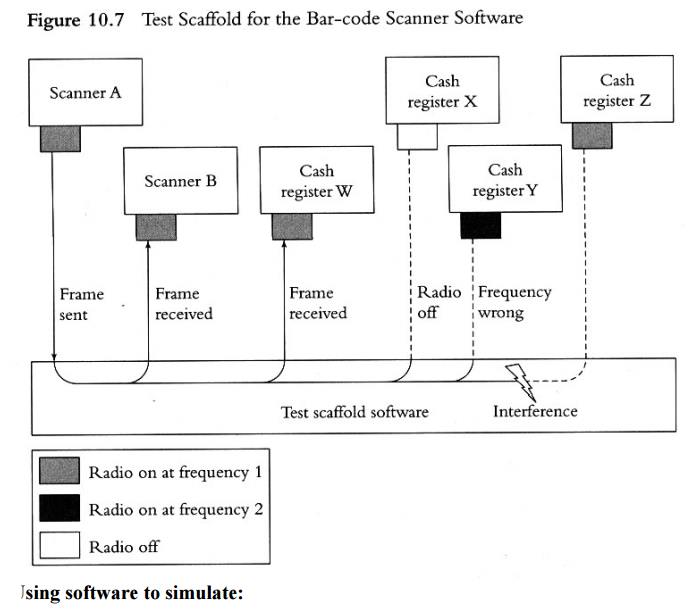
Using software to simulate:
n The
target microprocessor instruction set
n The
target memory (types - RAM)
n The
target microprocessor architecture (interconnections and components)
n Simulator
– must understand the linker/locator Map format, parse and interpret it
n Simulator
– takes the Map as input, reads the instructions from simulated ROM,
reads/writes from/to simulated registers
n Provide a
user interface to simulator for I/O, debugging (using, e.g., a macro language)
n Capabilities of Simulators:
n Collect
statistics on # instructions executed, bus cycles for estimating actual times
n Easier to
test assembly code (for startup software and interrupt routines) in simulator
n Easier to
test for portability since simulator takes same Map as the target
n Other
parts, e.g., timers and built-in peripherals, can be tested in the
corresponding simulated versions in the simulated microprocessor architecture
n What
simulators can’t help:
n Simulating
and testing ASICs, sensors, actuators, specialized radios (perhaps, in future
systems!!)
n Lacking
I/O interfaces in simulator to support testing techniques discussed (unless
additional provision is made for I/O to support the scaffold; and scripts to
format and reformat files between the simulator, simulated memory, and the
scaffold)
n Logic Analyzer
n Like
storage scopes that (first) capture many signals and displays them
simultaneously
n It knows
only of VCC and ground voltage levels (displays are like timing diagrams) –
Real scopes display exact voltage (like analog)
n Can be
used to trigger on-symptom and track back in stored signal to isolate problem
n Many
signals can be triggered at their low and/or high points and for how long in
that state
n Used in
Timing or State Mode
n Logic Analyzers in Timing Mode
n Find out
if an event occurred – did cordless scanner turn on the radio?
n Measure
how long it took software to respond to an interrupt (e.g., between a button
interrupt signal and activation signal of a responding device – to turn off an
bell)
n Is the
software putting out the right pattern of signals to control a hardware device
– looking
back in the captured signal for elapsed time
n Logic Analyzers in State Mode
n Captures
signals only on clock-event occurring
from the attached hardware
n Typical
use: instructions read/fetched by microprocessor, data read from or written to
ROM, RAM, or I/O devices
n To do so,
connect LA to address and data signals and RE/ signal on the ROM (or RAM)
n If
triggering is on rising edge of RE/ pin, address and data signals will be
captured
n Output of
LA, called trace, is stored for
later analysis – see Fig 10.18
n LA can be
triggered on unusual event occurrences, then capture signals therefrom
–
especially for debugging purposes (e.g., writing data to wrong address,
tracking a rarely occurring bug, filtering signals for select devices or
events)
n LA can’t
capture all signals, e.g., on fetch from caches, registers, un-accessed memory
Related Topics