Chapter: Modern Analytical Chemistry: Titrimetric Methods of Analysis
Selecting and Evaluating the End Point - Titrations Based on Redox Reactions
Selecting and Evaluating the End Point
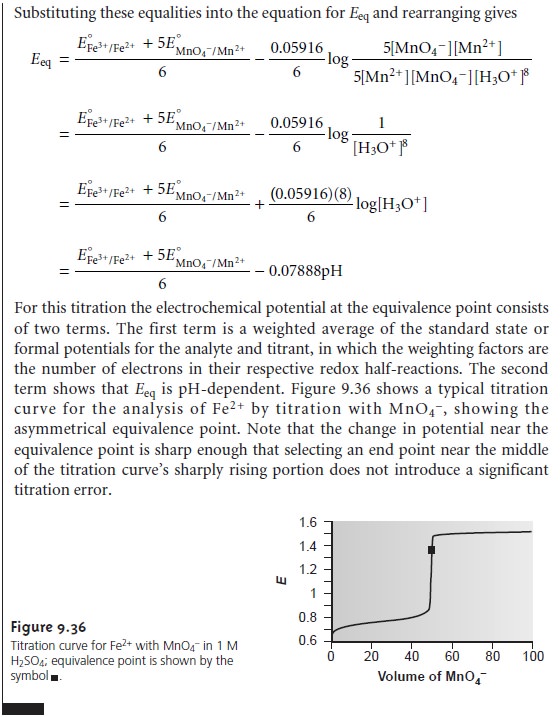
The equivalence point of a redox titration occurs when stoichiometrically
equiva- lent amounts of analyte and titrant react.
As with other
titrations, any difference be- tween the equivalence point and the
end point is a determinate source of error.
Where Is the Equivalence Point?
In discussing acid–base titrations and com- plexometric titrations, we noted that the equivalence point is almost
identical with the inflection point
located in the sharply rising
part of the titration curve.
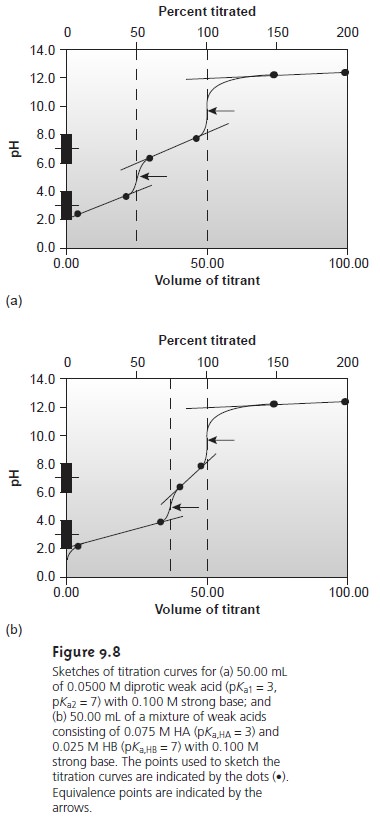
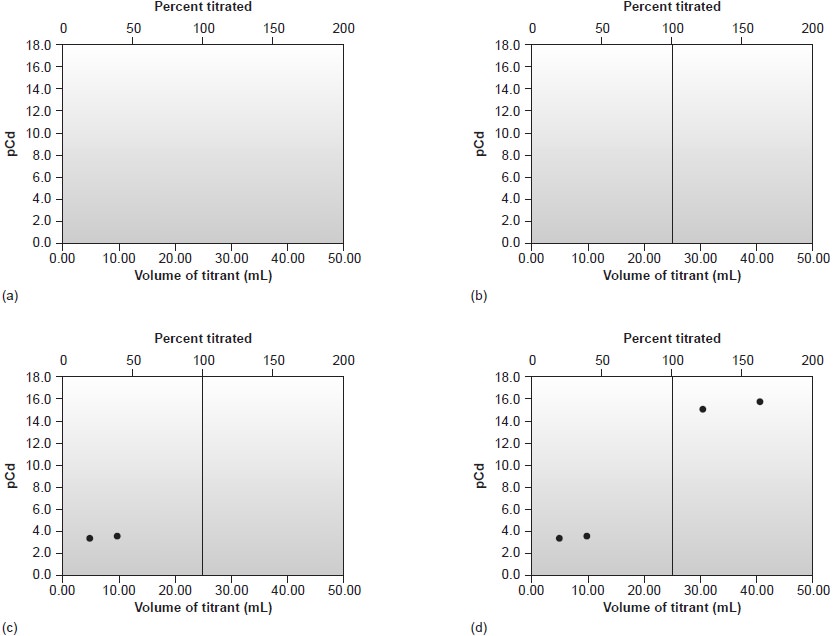
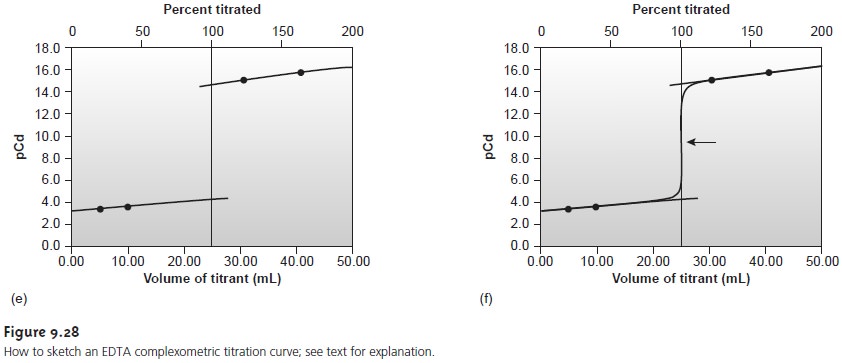
If you look
back at Figures
9.8 and 9.28,
you will see
that for acid–base and com-
plexometric titrations the inflection point
is also in the middle
of the titration curve’s sharp rise (we call this a symmetrical equivalence point). This makes it
relatively easy to find the equivalence point when you sketch these titration
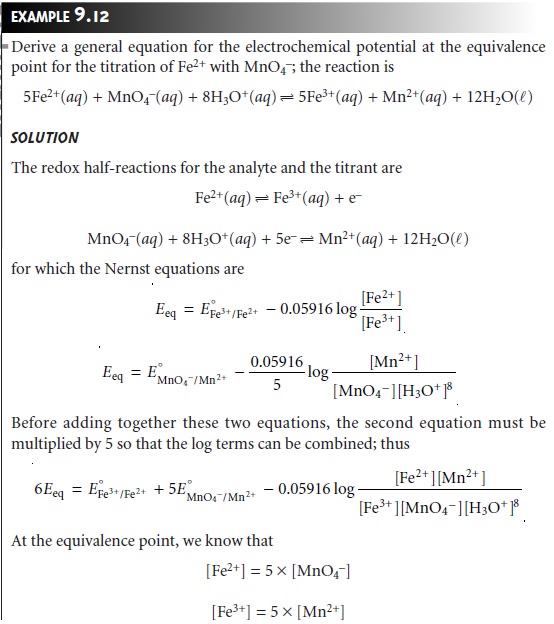
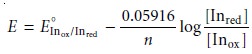
curves. When the stoichiometry of a redox titration is symmetrical (one mole analyte per
mole of titrant), then the equivalence point also is symmetrical. If the stoichiometry is not symmetrical, then the equivalence point will lie closer to the top or bottom of the titration curve’s sharp rise. In this case the equivalence
point is said
to be asymmetrical. Example 9.12
shows how to calculate the
equiv- alence point potential in this situation.
Finding the End Point with a Visual Indicator
Three types of visual indicators are used to signal the end point in a redox titration. A few titrants,
such as MnO4–, have oxidized and reduced forms
whose colors in solution are signifi-
cantly different. Solutions of MnO4– are intensely purple. In acidic solutions,
however, permanganate’s reduced
form, Mn2+, is nearly colorless. When MnO4– is used as an oxidizing titrant,
the solution remains
colorless until the first drop of
excess MnO4– is
added. The first permanent tinge of purple signals the end point.
A
few substances indicate
the presence of a specific
oxidized or reduced
species. Starch, for example,
forms a dark blue complex
with I3– and can be used to signal the presence of excess
I3– (color change:
colorless to blue),
or the completion of a reaction in which I3– is consumed (color change: blue
to colorless). Another
exam- ple of a specific indicator is thiocyanate, which
forms a soluble
red-colored com- plex,
Fe(SCN)2+,
with Fe3+.
The most important class of redox
indicators, however, are substances that do
not participate in the redox
titration, but whose
oxidized and reduced
forms differ in color.
When added to a solution
containing the analyte,
the indicator im- parts a color that
depends on the
solution’s electrochemical potential. Since the indicator
changes color in response to the electrochemical potential, and not to
the presence or absence of a specific
species, these compounds
are called general redox indicators.
The relationship between
a redox indicator’s change in color
and the solution’s electrochemical potential is
easily derived by considering the half-reaction for the indicator
Inox + ne– < == == > Inred
where Inox and Inred are, respectively, the
indicator’s oxidized and
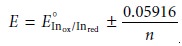
reduced forms. The Nernst equation for this reaction
is
If
we assume that the indicator’s color in solution
changes from that of Inox to that of Inred when
the ratio [Inred]/[Inox] changes
from 0.1 to 10, then
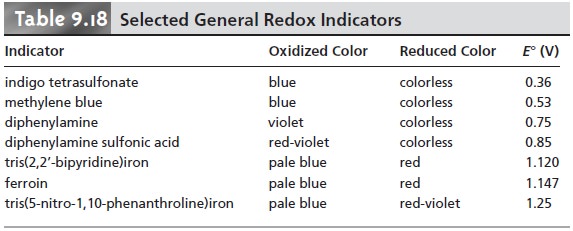
the end point occurs
when the solution’s electrochemical potential is within the range
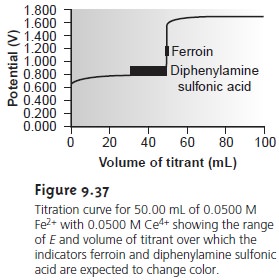
A partial list of general redox indicators is shown in Table 9.18. Examples of appropriate and inappropriate indicators for the titration of Fe2+ with Ce4+ are shown in Figure 9.37.
Finding the End Point Potentiometrically
Another method for locating the end point of a redox titration is to use
an appropriate electrode
to monitor the change in electrochemical potential as titrant
is added to a solution
of analyte. The end point can then be found from a visual
inspection of the titration
curve. The simplest
experimental design (Figure 9.38) consists of a Pt indica- tor
electrode whose potential is governed by the analyte’s or titrant’s redox half-reaction, and a reference
electrode that has a fixed potential.

Related Topics