Chapter: Embedded Systems
Debugging on Embedded Systems
DEBUGGING ON EMBEDDED SYSTEMS
Unit
Structure
Objectives
1. Introduction
2. Downloading the embedded code
3. Debugging the embedded software
Remote
Debuggers
Emulators
Simulators
4. Other Tools
OBJECTIVES
After reading this
chapter you will understand:
Concept of downloading
the embedded code
Debugging the embedded
software
Different possible
tools available for debugging
Difference between
Remote Debugger, Emulator & Simulator
1. INTRODUCTION
In the previous chapter we saw how the code or
software to be executed on the embedded system (target board) is written on a computer.
The resulting code created after subjecting it to be build process is called
the binary executable image or simply
hex code.
This chapter explains how the hex code is put on
the target board which is referred as downloading and what are the various
possible ways of debugging a code meant to run on a embedded system.
2
DOWNLOADING THE EMBEDDED CODE
The code to be run on the target embedded system
is always developed on the host computer. This code is called the binary executable image or simply hex code.
The process of putting this code in the memory
chip of the target embedded system is called Downloading.
There are two ways of downloading the binary
image on the embedded system:
1.
Using a Device Programmer
A device programmer is a piece of hardware that
works in two steps.
Step
1 Once the binary image is ready on the computer,
the device programmer is connected
to the computer and the binary image is transferred to the device programmer.
Step
2 The microcontroller/microprocessor or memory chip,
usually the ROM which is supposed to
contain the binary image is placed on the proper socket on the device
programmer. The device programmer contains a software interface through which
the user selects the target microprocessor for which the binary image has to be
downloaded. The Device programmer then transfers the binary image bit by bit to
the chip.
2.
Using In System Programmer(ISP)
Certain Target embedded platforms contain a
piece of hardware called ISP that have a hardware interface to both the
computer as well the chip where the code is to be downloaded.
The user through the ISP’s software interface
sends the binary image to the target board.
This avoids the requirement of frequently
removing the microprocessor / microcontroller or ROM for downloading the code
if a device programmer had to be used.
3
DEBUGGING THE EMBEDDED SOFTWARE
Debugging is the process of eliminating the
bugs/errors in software.
The software written to run on embedded systems
may contain errors and hence needs debugging.
However, the difficulty in case of embedded
systems is to find out the bug/ error itself. This is because the binary image
you downloaded on the target board was free of syntax errors but still if the
embedded system does not function the way it was supposed to be then it can be
either because of a hardware problem or a software problem. Assuming that the
hardware is perfect all that remains to check is the software.
The difficult part here is that once the
embedded system starts functioning there is no way for the user or programmer
to know the internal state of the components on the target board.
The most primitive method of debugging is using
LEDs. This is similar to using a printf or a cout statement in c/c++ programs
to test if the control enters the loop or not. Similarly an LED blind or a
pattern of LED blinks can be used to check if the control enters a particular
piece of code.
There are other advanced debugging tools like;
Remote
debugger
Emulator
Simulator
3.1
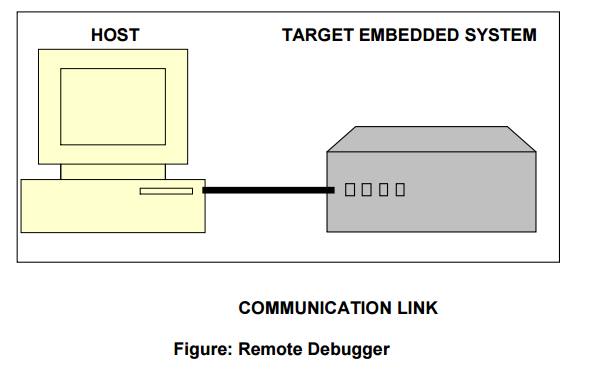
Remote Debuggers
Remote Debugger is a tool that can be commonly
used for:
Downloading
Executing and
Debugging embedded
software
A Remote Debugger contains a hardware interface
between the host computer and the target embedded system.
The Software interface of the remote debugger
has GUI-based main window and several smaller windows for the source code,
register contents and other information about the executing program.
It
contains two pieces of software :
Frontend
remote debugger
It runs on
the host computer.
It
provides the human interface.
Backend
remote debugger
Backend remote debugger runs on the target processor.It communicates with the frontend over a communications link of some
sort.
It provides for low-level control of the target processorand is usually called the debug monitor.
Debug monitoris a piece of software
that has beendesigned specifically for use as a debugging
tool for processors and chips.
It is automatically started whenever the processor is reset.
It
monitors the communication link to the host computer and responds to requests from the remote debugger running there.
One such
debugger is the GNU.
It was
originally designed for native debugger.
It
performs cross-debugging.
Communication
between the GDB frontend and debug monitor is byte-oriented and designed for
transmission over a serial connection.
3.2 Emulators
A Remote debugger is helpful for monitoring and
controlling the state of embedded software prior to downloading it only.
An Emulator allows you to examine the state of
the processor on which that program is actually running. It is itself an
embedded system, with its own copy of the target processor, RAM, ROM, and its
own embedded software
An Emulator takes the place of-or emulates-the
processor on the target board.
Emulator uses a remote debugger for its human
interface.
Emulator supports such powerful debugging
features such as hardware breakpoints and real-time tracing. Hardware
breakpoints allow you to stop execution in response to a wide variety of
events. These events include instruction fetches, memory and I/O reads and
writes and interrupts. Real Time tracing allows you to see the exact order in
which events occurred, so it can help you answer questions related to specific
errors.
ROM Emulator
It is a device that
emulates a read only memory device like ICE (in-circuit emulator).
It connects to the
target embedded system and communicates with the host.
When a target
connection is via a ROM socket to embedded system it looks like any other read
only memory. But when it is to the remote debugger it looks like a debug
monitor.
Advantages:
There is no need to
port the debug monitor code to particular target hardware.
The ROM emulator
supplies its own serial or network connection to the host
The ROM emulator is a
true replacement for the original ROM, so none of the target’s memory is used
up by the debug monitor code
3.3
Simulators
A simulator is a
completely host-based program that simulates the functionality and instructions
set of the target processor.
Advantage: A Simulator
can be quite valuable in the earlier stage of a project when there has not yet
been any actual hardware implementation for the programmers to experiment with.
Disadvantage: One of
the disadvantages of simulator is that it only simulates the processors.
4 OTHER
TOOLS
Logic Analyzers and Oscilloscopes are very
important debugging tools.
Logic Analyzers
It is a piece of
laboratory equipment that is designed especially for troubleshooting digital
hardware.
It can have multiple
inputs (up to 100 even), each capable of detecting whether the electrical
signal it is attached to is currently at logic level 1 or 0
An
oscilloscope is another pieces of laboratory equipment of hardware debugging.
But this one is used to examine any electrical signal, analog or digital, on
any piece of hardware
Oscilloscopes
An
oscilloscope is another pieces of laboratory equipment of hardware debugging.
But this one is used to examine any electrical signal, analog or digital, on
any piece of hardware
Oscilloscope
are sometimes useful for quickly observing the voltage on the particular pin
or, in the absence of a logic analyzer, for something ,more complex
Related Topics