Chapter: Modern Analytical Chemistry: Spectroscopic Methods of Analysis
Quantitative Applications - Ultraviolet-Visible and Infrared Spectrophotometry
Quantitative Applications
The determination of an analyte’s concentration based on its absorption of ultravi- olet or visible radiation
is one of the most frequently encountered quantitative ana-
lytical methods. One
reason for its
popularity is that
many organic and
inorganic compounds have strong
absorption bands in the UV/Vis
region of the electromag-
netic spectrum. In addition, analytes
that do not absorb UV/Vis radiation, or that
absorb such radiation only weakly, frequently can be chemically coupled to a species that does. For example, nonabsorbing solutions of Pb2+ can be reacted with dithizone to form the red Pb–dithizonate complex. An additional advantage to UV/Vis absorption is that in most cases it is relatively easy to adjust experimental
and instrumental conditions so that Beer’s
law is obeyed.
Quantitative analyses based on the absorption of infrared radiation, although important, are less frequently encountered than those for UV/Vis absorption. One reason is the
greater tendency for
instrumental deviations from
Beer’s law when using infrared radiation. Since infrared absorption bands are relatively narrow, de- viations due to the lack of monochromatic radiation
are more pronounced. In addi- tion, infrared sources are less
intense than sources
of UV/Vis radiation, making stray radiation more of a problem. Differences in pathlength for samples and stan-
dards when using thin liquid
films or KBr pellets are a problem,
although an inter- nal standard can be used to correct for any difference in pathlength. Finally,
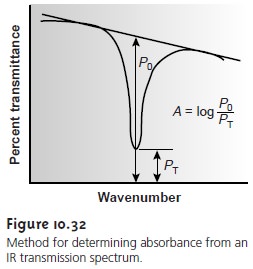
estab- lishing a 100% T (A = 0) baseline is often difficult since the optical
properties of NaCl sample cells may change significantly with wavelength due to contamination and degradation. This problem
can be minimized by determining absorbance rela-
tive to a baseline established for the absorption band. Figure 10.32
shows how this is
accomplished.
The applications of Beer’s law for the quantitative analysis of samples in envi- ronmental chemistry, clinical chemistry, industrial chemistry and forensic chem- istry are numerous. Examples from each of these fields follow.
Environmental Applications
Methods for the analysis of waters and
wastewaters relying on the absorption of UV/Vis radiation
are among some of the most fre- quently employed analytical methods. Many of these methods are outlined in Table 10.6,
and a few are described later in more detail.
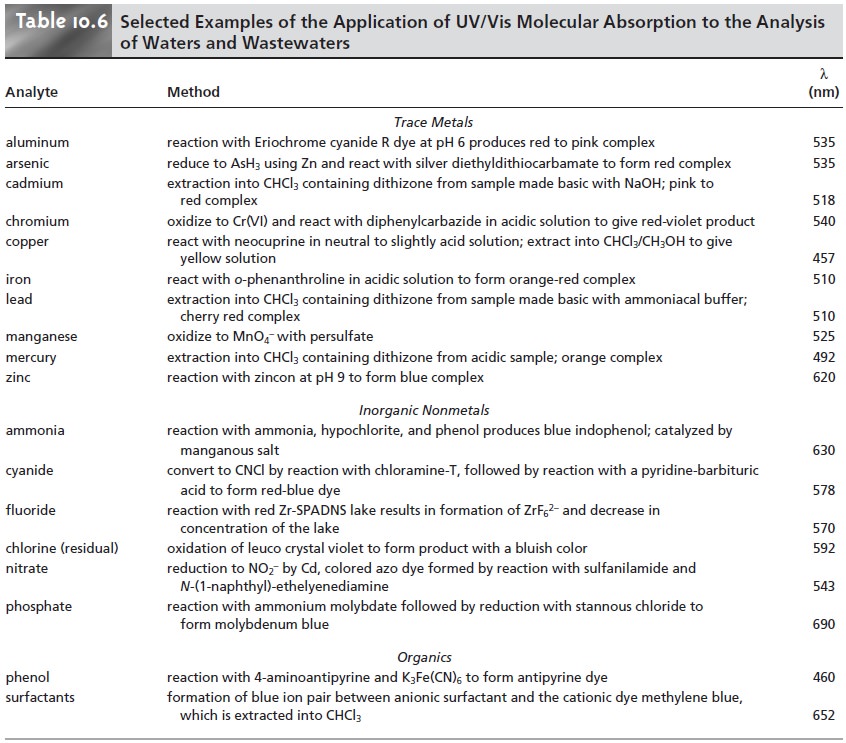
Although the quantitative analysis of metals
in water and
wastewater is ac- complished
primarily by atomic absorption or atomic emission spectroscopy, many metals also can be analyzed
following the formation
of a colored metal– ligand complex. One advantage to these spectroscopic methods is that
they are easily adapted
to the field analysis of samples using
a filter photometer. One lig- and used in the analysis of several metals is diphenylthiocarbazone, also known as dithizone. Dithizone is insoluble in water, but when a solution of dithizone in CHCl3 is shaken with an aqueous
solution containing an appropriate metal
ion, a colored metal–dithizonate complex forms that
is soluble in CHCl3. The
selectivity of dithizone is controlled by adjusting the pH of the aqueous
sample. For exam- ple, Cd2+ is
extracted from solutions
that are made strongly basic with NaOH, Pb2+ from solutions that are made basic with an ammoniacal buffer, and Hg2+ from solutions
that are slightly
acidic.
When chlorine is added to water that portion available
for disinfection is called
the chlorine residual. Two forms
of the chlorine residual are recognized. The free chlorine residual includes Cl2, HOCl,
and OCl–. The
combined chlorine residual, which forms from the reaction of NH3 with
HOCl, consists of monochloroamine,
NH2Cl, dichlororamine, NHCl2, and trichloroamine, NCl3. Since the free
chlorine residual is more efficient at disinfection, analytical methods have been developed to determine the concentration of both forms of residual
chlorine. One such method
is the leuco crystal violet
method. Free residual chlorine is determined by adding leuco crystal
violet to the sample, which
instantaneously oxidizes giving
a bluish color that is monitored at 592 nm. Completing the analysis in less than 5 min pre-
vents a possible interference from the combined chlorine residual. The total chlo- rine residual (free + combined) is determined by reacting a separate sample with io- dide,
which reacts with
both chlorine residuals to form HOI.
When the reaction is complete, leuco crystal
violet is added and oxidized
by HOI, giving the same bluish
colored product. The combined chlorine
residual is determined by difference.
|
6 |
Spectroscopic methods also are used in determining organic
constituents in water. For example,
the combined concentrations of phenol, and ortho- and meta-
substituted phenols are
determined by using
steam distillation to separate the
phe- nols from nonvolatile impurities. The distillate is reacted with
4-aminoantipyrine at pH 7.9 ±
0.1 in the presence of K3Fe(CN)6, forming
a colored antipyrine dye. The dye is extracted into CHCl3, and the absorbance is monitored at 460 nm. A
calibration curve is prepared using
only the unsubstituted phenol, C6H5OH. Be- cause the molar absorptivities of substituted phenols
are generally less than that for
phenol, the reported concentration represents the minimum concentration of phe- nolic compounds.
Molecular absorption also can be used for the analysis of environmentally sig- nificant airborne pollutants. In many cases the analysis is carried out by collecting the sample in water, converting the analyte to an aqueous form that can be analyzed by methods such as those described in Table 10.6. For example, the concentration of NO2 can be determined by oxidizing NO2 to NO3–. The concentration of NO3– is then determined by reducing to NO3– with Cd and reacting the NO3– with sulfanil- amide and N-(1-naphthyl)-ethylenediamine to form a brightly colored azo dye. An- other important application is the determination of SO2, which is determined by collecting the sample in an aqueous solution of HgCl42– where it reacts to form Hg(SO ) 2–. Addition of p-rosaniline and formaldehyde results in the formation of a bright purple complex that is monitored at 569 nm. Infrared absorption has proved useful for the analysis of organic vapors, including HCN, SO2, nitrobenzene, methyl mercaptan, and vinyl chloride. Frequently, these analyses are accomplished using portable, dedicated infrared photometers.
Clinical Applications
UV/Vis molecular absorption is one of the most commonly
employed techniques for the analysis
of clinical samples,
several examples of which
are listed in Table 10.7.
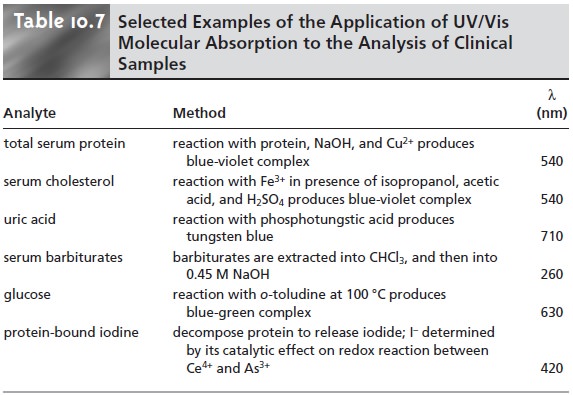
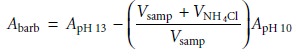
The analysis of clinical samples
is often complicated by the complexity of the sample
matrix, which may contribute a significant background absorption at the desired wavelength. The determination of serum barbiturates provides one example of how this problem
is overcome. The barbiturates are extracted from a sample
of serum with CHCl3, and extracted from the CHCl3 into 0.45 M NaOH (pH ~ 13). The
absorbance of the aqueous extract
is measured at 260 nm and includes
contri- butions from the barbiturates as well as other components extracted from the serum sample.
The pH of the sample
is then lowered
to approximately 10 by adding NH4Cl, and
the absorbance remeasured. Since the barbiturates do not absorb
at this pH, the absorbance at pH 10 is used to correct
the absorbance at pH 13; thus
Industrial Analysis
UV/Vis molecular absorption is used for the analysis
of a di- verse array of industrial samples, including pharmaceuticals, food,
paint, glass, and metals. In many cases
the methods are
similar to those
described in Tables
10.6 and 10.7. For example,
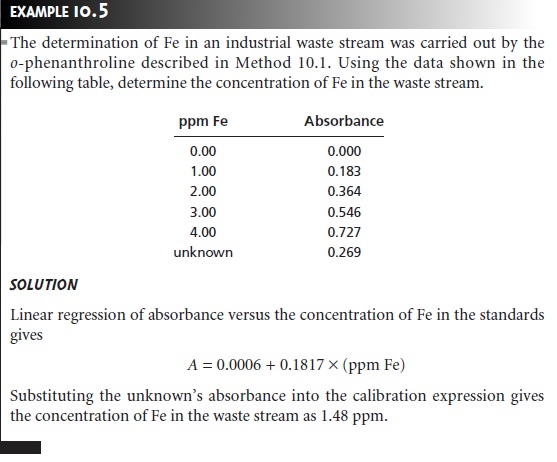
the iron content
of food can be determined by bringing the iron
into solution and analyzing using
the o-phenanthroline method listed
in Table 10.6.
Many pharmaceutical compounds contain chromophores that
make them suit- able for analysis by UV/Vis absorption. Products that have
been analyzed in this
fashion include antibiotics, hormones, vitamins, and
analgesics. One example
of the use of UV absorption is in determining the purity of aspirin tablets, for which the active ingredient is acetylsalicylic acid. Salicylic acid, which is produced by the hy- drolysis of acetylsalicylic acid,
is an undesirable impurity in aspirin tablets, and should not be present
at more than 0.01% w/w. Samples can be screened
for unac- ceptable levels
of salicylic acid by monitoring the absorbance at a wavelength of 312 nm.
Acetylsalicylic acid absorbs
at 280 nm,
but absorbs poorly
at 312 nm.
Con- ditions for preparing the sample are
chosen such that
an absorbance of greater than 0.02
signifies an unacceptable level of salicylic acid.
Forensic Applications
UV/Vis molecular absorption is routinely used in the analy-
sis of narcotics and for drug testing.
One interesting forensic
application is the de-
termination of blood
alcohol using the Breathalyzer test.
In this test a 52.5-mL breath sample is bubbled
through an acidified solution of K2Cr2O7. Any ethanol
present in the breath sample
is oxidized by the dichromate, producing acetic acid and
Cr3+ as products. The concentration of ethanol in the breath
sample is deter- mined from the decrease in absorbance at 440 nm where the
dichromate ion ab- sorbs. A blood alcohol
content of 0.10%,
which is the legal limit
in most states,
cor- responds to 0.025
mg of ethanol in the
breath sample.
Developing a Quantitative Method for a Single Component
In developing a quan- titative analytical procedure, the conditions under which Beer’s law is obeyed must be established. First, the most appropriate wavelength for the analysis is determined from an absorption spectrum. In most cases the best wavelength corresponds to an absorption maximum because it provides greater sensitivity and is less susceptible to instrumental limitations to Beer’s law due to the lack of monochromatic radia- tion. Second, if an instrument with adjustable slits is being used, then an appropri- ate slit width needs to be chosen. The absorption spectrum also aids in selecting a slit width. Generally the slit width should be as wide as possible to increase the throughput of radiation from the source, while being narrow enough to avoid in- strumental limitations to Beer’s law. Finally, a calibration curve is constructed to determine the range of concentrations for which Beer’s law is valid. Additional con- siderations that are important in any quantitative method are the effect of potential interferents and establishing an appropriate blank.
Quantitative Analysis for a Single Analyte
The concentration of a single
analyte is determined by measuring the
absorbance of the
sample and applying Beer’s law
(equation 10.5) using
any of the standardization methods. The most common methods
are the normal
calibration curve and the method
of standard additions. Single-point standardizations also can be used, provided that the
validity of Beer’s
law has been demonstrated.
Quantitative Analysis of Mixtures
The analysis of two or more components in the same sample
is straightforward if there are regions in the sample’s
spectrum in which each component is the only absorbing species.
In this case each component can be analyzed as if it were the only species
in solution. Unfortunately, UV/Vis ab- sorption bands
are so broad that it frequently is impossible to find appropriate wavelengths at which each component of a mixture
absorbs separately. Earlier
we learned that Beer’s law is additive (equation
10.6); thus, for a two-component mix- ture of X and Y, the mixture’s absorbance, Am, is
(Am)λ1 = (εX)λ1bCX + (εY)λ1bCY ……….10.11
where λ1 is the wavelength at which the absorbance is measured. Since
equation 10.11 includes terms
for both the concentrations of X and Y, the absorbance at one wave- length does not provide
sufficient information to determine either
CX or CY. If we measure the
absorbance at a second wavelength, λ2,
(Am)λ2 = (εX)λ2bCX + (εY)λ2bCY ……….10.12
then CX and CY can be determined by solving equations 10.11 and 10.12.
Of course, it is necessary to determine values for ε for each component at both wavelengths. In general, for a mixture of n components, the absorbance must be measured
at n dif- ferent wavelengths.
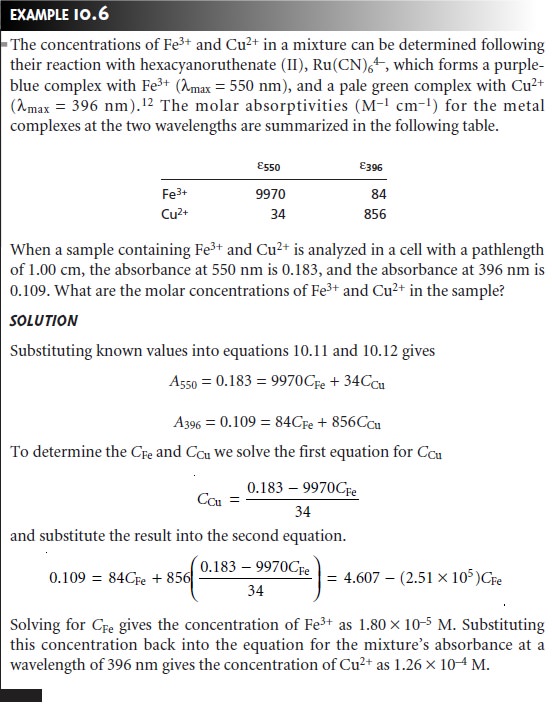
To obtain results
with good accuracy and precision the
two wavelengths should be selected so that εX >
εY at one wavelength and εY <
εX at the other wavelength. The optimum precision is obtained when the difference in molar absorptivities is as large as possible. One method for locating the optimum wavelengths, therefore, is to plot
εX/εY as a function of wavelength and determine the wavelengths at which εX/εY reaches maximum and minimum
values.
Two additional methods
for determining the composition of a mixture
deserve mention. In multiwavelength linear regression analysis
(MLRA) the absorbance of a mixture is compared with that of standard solutions at several wavelengths. If ASX
and ASY are the
absorbances of standard solutions of components X and Y at any wavelength, then
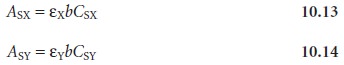
where CSX and CSY are the known
concentrations of X and Y in the standard solu- tions. Solving equations 10.13
and 10.14 for εX and εY, substituting into equation (the wavelength designation can be dropped), and rearranging gives
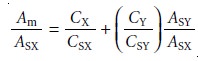
To determine CX and CY, the mixture’s absorbance and the absorbances of the stan- dard solutions are measured
at several wavelengths. Plotting Am/ASX versus ASY/ASX gives a straight line with a slope of CY/CSY and a y-intercept of CX/CSX.
The generalized standard
addition method (GSAM) extends the analysis of mixtures to situations in which matrix
effects prevent the determination of εX andεY using external standards. When adding a known concentration of analyte to a
solution containing an unknown concentration of analyte, the concentrations usu- ally
are not additive. Conservation of mass,
however, is always obeyed.
Equation 10.11 can
be written in terms of moles, n, by
using the relationship
 10.15
10.15
where V is the total
solution volume. Substituting equation 10.15 into 10.11 and gives
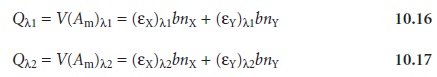
where Q is the volume-corrected absorbance. If a standard
is added to the sample, the moles of X and Y increase by the amount
∆nX and ∆nY, and the new
volume- corrected absorbances are
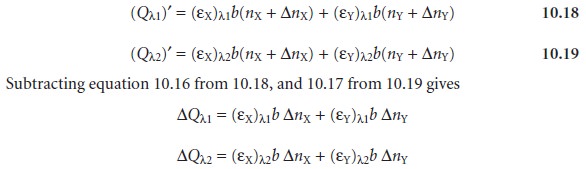
Values for (εX)λ1, (εY)λ1,
(εX)λ2, and (εY)λ2 are obtained by
plotting ∆Qλ1 versus ∆nX, ∆Qλ1 versus
∆nY, ∆Qλ2 versus
∆nX, and
∆Qλ2 versus
∆nY and determining the slopes. Equations 10.16 and
10.17 can then
be solved to determine nX and nY.
Related Topics