Chapter: Modern Analytical Chemistry: Spectroscopic Methods of Analysis
Instrument Designs for Molecular UV/Vis Absorption - Ultraviolet-Visible and Infrared Spectrophotometry
Instrumentation
Frequently an analyst
must select, from
several instruments of different design,
the one instrument best suited for a particular analysis. In this section we examine
some of the different types
of instruments used for molecular absorption spec-
troscopy, emphasizing their advantages and limitations. Methods
of sample intro- duction are also covered
in this section.
Instrument Designs for Molecular UV/Vis Absorption
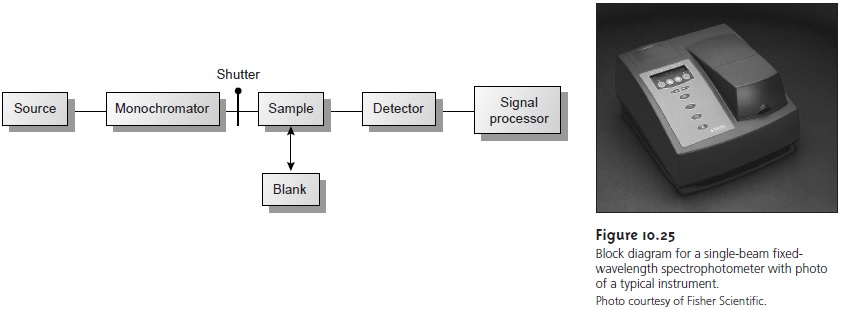
The simplest instrument cur- rently used for molecular UV/Vis
absorption is the filter photometer shown in Fig- ure 10.24,
which uses an absorption or interference filter
to isolate a band of radia-
tion. The filter is placed between the source and sample to prevent the sample from decomposing when exposed to high-energy radiation. A filter photometer has a sin- gle
optical path between
the source and detector and is called
a single-beam instru- ment. The instrument is calibrated to 0% T while using a shutter
to block the source
radiation from the
detector. After removing the shutter, the
instrument is calibrated to 100% T using an appropriate blank.
The blank is then replaced
with the sample, and its transmittance is measured. Since
the source’s incident
power and the sensitiv-
ity of the detector vary with wavelength, the photometer must be recalibrated when- ever the filter
is changed. In comparison with
other spectroscopic instruments, pho- tometers have the advantage of being relatively inexpensive, rugged, and easy to maintain. Another advantage of a photometer is its portability, making it a useful in- strument for conducting spectroscopic analyses in the field. A disadvantage of a pho- tometer is that it cannot be used to obtain an absorption spectrum.
Instruments using monochromators for wavelength
selection are called spectrometers. In
absorbance spectroscopy, where the transmittance is a ratio of two radiant
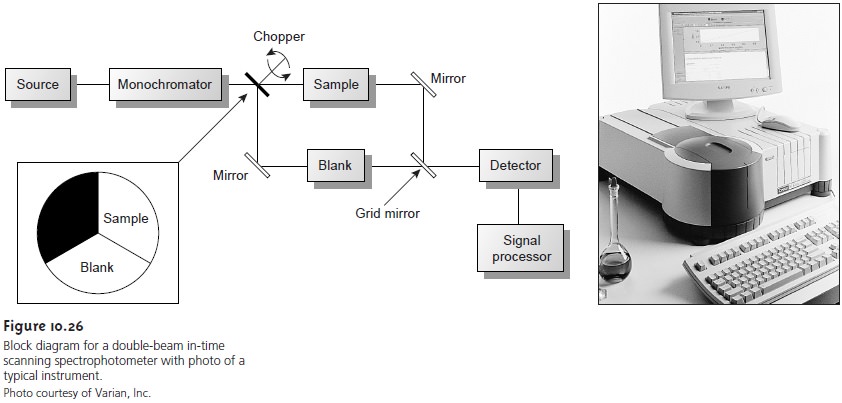
powers, the instrument is called a spectrophotometer. The simplest
spectrophotometer
is a single-beam instrument equipped with a fixed-
wavelength monochromator, the block diagram for which is shown in Figure
10.25. Single-beam spectrophotometers are calibrated and used in the same
manner as a photometer. One common example
of a single-beam spectropho-
tometer is the Spectronic-20 manufactured by Milton-Roy. The Spectronic-20 can be used from
340 to 625
nm (950 nm with a red-sensitive detector), and has a fixed effective
bandwidth of 20 nm. Because
its effective bandwidth
is fairly large, this instrument is more appropriate for a quantitative analysis than for a
qualitative analysis. Battery-powered,
hand-held single-beam spectrophotome- ters are
available, which are
easily transported and
can be used
for on-site analy-
ses. Other single-beam spectrophotometers are available with effective
band- widths of 2–8 nm. Fixed-wavelength
single-beam spectrophotometers are not practical for recording spectra
since manually adjusting the wavelength and
re- calibrating the
spectrophotometer is awkward and time-consuming. In addition, the accuracy
of a single-beam spectrophotometer is limited by the stability of its source
and detector over time.
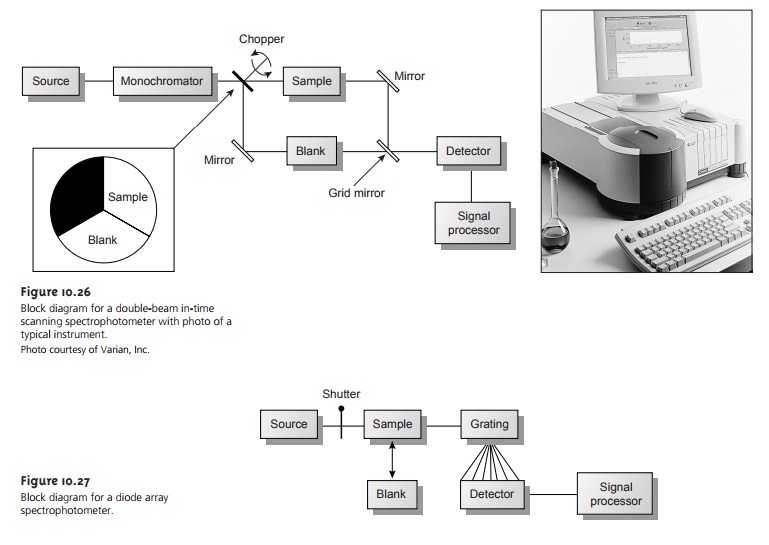
The limitations of fixed-wavelength, single-beam spectrophotometers are mini- mized by using the double-beam in-time spectrophotometer as shown in Figure 10.26.
A chopper, similar
to that shown in the insert,
controls the radiation’s path, alternat-
ing it between the sample,
the blank, and a shutter.
The signal processor
uses the chop- per’s known speed of rotation
to resolve the signal reaching the detector
into that due to the
transmission of the blank (P0) and
the sample (PT). By including
an opaque sur- face
as a shutter it is possible to continuously adjust the 0% T response of the detector.
The effective bandwidth
of a double-beam spectrophotometer is controlled by means of
adjustable slits at the entrance
and exit of the monochromator. Effective band- widths
of between 0.2 nm and 3.0 nm are common.
A scanning monochromator al- lows for the automated recording of spectra.
Double-beam instruments are more ver- satile than single-beam instruments, being useful for
both quantitative and
qualitative analyses; they are, however, more expensive.
The instrument designs
considered thus far use a single detector
and can only monitor one wavelength at a time.
A linear photodiode array consists of multiple de- tectors, or channels, allowing
an entire spectrum
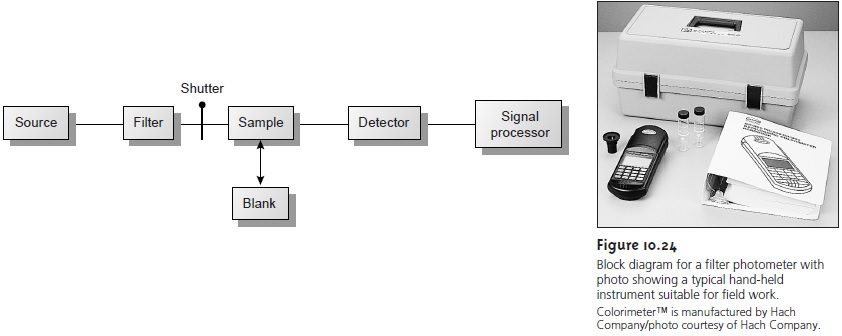
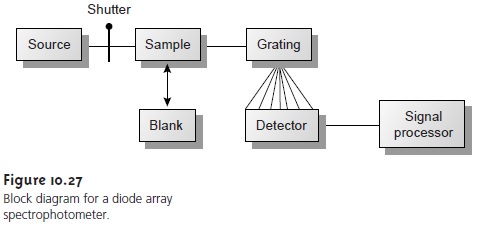
to be recorded in as little as 0.1 s. A
block diagram for
a typical multichannel spectrophotometer is shown
in Figure 10.27.
Source radiation passing
through the sample
is dispersed by a grating. The linear pho- todiode array
is situated at the grating’s focal plane, with each diode
recording the ra- diant power
over a narrow range of wavelengths.
One advantage of a linear
photodiode array is the speed
of data acquisition, which makes
it possible to collect several
spectra for a single sample.
Individual spec- tra are added and averaged to obtain the final spectrum.
This process of signal aver-
aging improves a spectrum’s signal-to-noise ratio. When a series of spectra is added,
the sum of the signal at any point increases
as (nSx), where n is the number of spec- tra, and Sx is the signal
for the spectrum’s x-th point.
The propagation of noise, which is a random
event, increases as ( Root of [nNx]), where Nx
is the noise level for the specctrum’s x-th point.
The signal-to-noise ratio
(S/N) at the x-th data point, there- fore, increases by a factor of Rt[n]
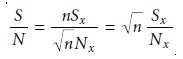
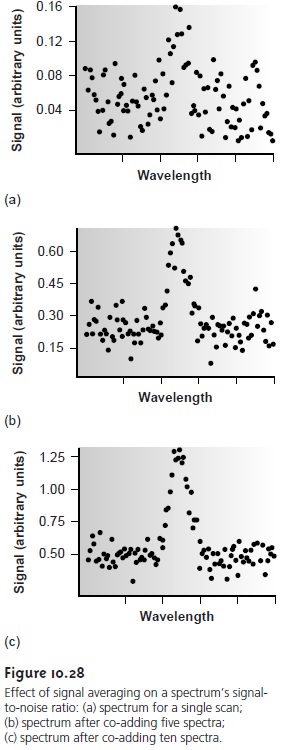
where (Sx/Nx) is the signal-to-noise ratio for a single scan. The effect of signal averaging is shown in Figure 10.28.
The spectrum in Figure 10.28a
shows the total signal
for a single scan. Although there is an apparent peak
near the cen- ter of the spectrum, the level of background noise
makes it difficult to mea- sure the
peak’s signal. Figures
10.28b and Figure
10.28c demonstrate the
im- provement in signal-to-noise ratio achieved by signal averaging. One disadvantage of a linear
photodiode array is that the effective bandwidth per diode is roughly
an order of magnitude larger than that obtainable with a
high-quality monochromator.
The sample compartment for the instruments in Figures 10.24–10.27 provides a light-tight environment that prevents the loss of radiation, as well
as the addition of stray
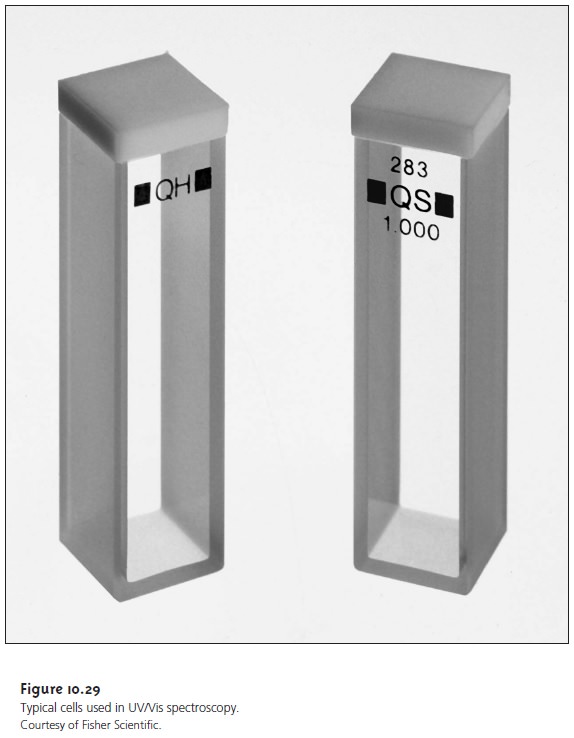
radiation. Samples are normally in the liquid
or solu- tion state
and are placed
in cells constructed with UV/Vis-transparent materi- als, such as quartz,
glass, and plastic
(Figure 10.29). Quartz or fused-silica cells are required when working at wavelengths of less than 300 nm where
other materials show a significant absorption. The most common cell has a pathlength of 1 cm, although cells
with shorter (>=
1 mm) and longer path- lengths (=< 10 cm)
are available. Cells
with a longer
pathlength are useful
for the analysis of very dilute
solutions or for gaseous samples.
The highest qual- ity cells are constructed in a rectangular shape, allowing the radiation to strike
the cell at a 90° angle, where
losses to reflection are minimal. These
cells, which are usually
available in matched
pairs having identical
optical proper- ties, are the cells of choice for double-beam instruments. Cylindrical test tubes are often used as a sample cell for simple,
single-beam instruments, al- though differences in the cell’s pathlength and optical properties add an addi- tional source of error
to the analysis.
In some circumstances it is desirable to monitor a system without
physi- cally removing a sample for analysis. This is often
the case, for example, with the
on-line monitoring of industrial production lines or waste lines, for physi-
ological monitoring, and for monitoring environmental systems. With the use of
a fiber-optic probe
it is possible to analyze
samples in situ.
A simple exam- ple of a remote-sensing, fiber-optic probe is shown in Figure 10.30a
and con- sists of two bundles
of fiber-optic cable.
One bundle transmits radiation from
the source to the sample cell, which is designed to allow for the easy flow of sample through the cell. Radiation from the source passes through the solu- tion, where it is reflected back by a mirror. The second bundle of fiber-optic cable transmits the nonabsorbed radiation to the wavelength selector. In an alternative design (Figure 10.30b), the sample cell is a membrane containing a reagent phase capable of reacting with the analyte.
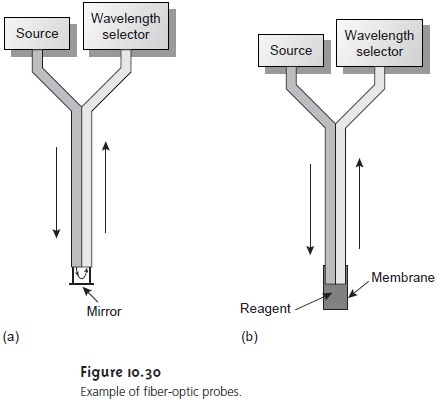
When the analyte diffuses across the membrane, it reacts with the reagent
phase, producing a product that ab-
sorbs UV or visible radiation. Nonabsorbed radiation from the source
is reflected or scattered back to the detector. Fiber-optic probes that show chemical selectivity are called optrodes.
Related Topics