Chapter: Modern Analytical Chemistry: Spectroscopic Methods of Analysis
Evaluation - Molecular Photoluminescence Spectroscopy
Evaluation
Scale of Operation
Molecular
photoluminescence can be used for the routine analysis of trace and
ultratrace analytes in macro and
meso samples. Detection limits for fluorescence spectroscopy are strongly influenced by the analyte’s quantum yield. For analytes with Φf >
0.5, detection limits
in the picomolar range are possible when using a high-quality spectrofluorometer. As an example, the detection limit
for qui- nine sulfate,
for which Φf is 0.55, is generally between
1 ppb and 1 ppTr (part per trillion). Detection limits for phosphorescence are somewhat poorer
than those for fluorescence, with typical values
in the nanomolar range for low-temperature phos- phorometry and in the micromolar range for
room-temperature phosphorometry using a solid
substrate.
Accuracy
The
accuracy of a fluorescence method is generally
1–5% when spectral and chemical interferences are insignificant. Accuracy
is limited by the same types
of problems affecting other spectroscopic methods. In addition, accuracy is affected by interferences influencing the fluorescent quantum
yield. The accuracy
of phos- phorescence is somewhat greater
than that for
fluorescence.
Precision
When the
analyte’s concentration is well above
the detection limit,
the relative standard deviation
for fluorescence is usually 0.5–2%.
The limiting instru- mental factor affecting precision is the stability of the excitation source. The preci- sion for phosphorescence is often
limited by reproducibility in preparing samples
for analysis, with
relative standard deviations of 5–10% being
common.
Sensitivity
From equations 10.32 and 10.33 we can see that the sensitivity of a flu- orescent or phosphorescent method is influenced by a number of parameters. The importance of quantum yield and the effect of temperature and solution composi- tion on Φf and Φp already have been considered.
Besides quantum yield, the sensi- tivity of an analysis can be improved by using an excitation source that has a greater emission intensity (P0) at the desired
wavelength and by selecting an excitation
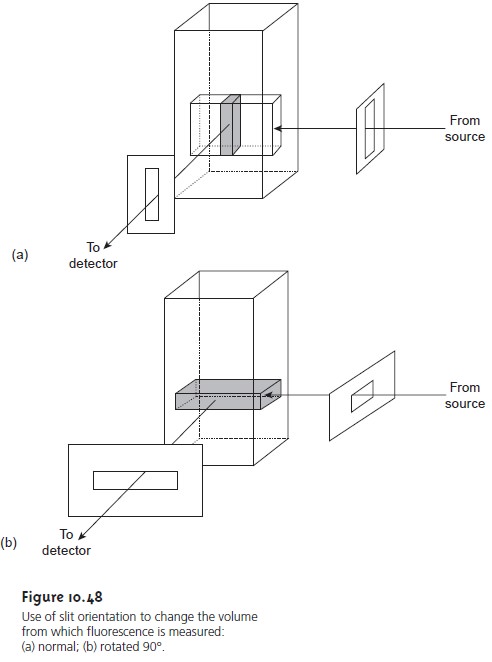
wavelength that corresponds to an absorption maximum (ε). Another
approach that can be used to increase sensitivity is to increase
the volume in the sample
from which emission is monitored. Figure
10.48 shows how
a 90° rotation of the
slits used to focus
the excitation source
on the sample
and to collect
emission from the sample can produce a 5–30-fold increase
in the signal.
Selectivity
The selectivity of molecular
fluorescence and phosphorescence is superior
to that of absorption spectrophotometry for two reasons: first, not every compound that absorbs radiation is fluorescent or phosphorescent, and, second,
selectivity between an analyte
and an interferant is possible
if there is a difference in either their excitation
or emission spectra.
In molecular lumines- cence the
total emission intensity is a linear sum
of that from each fluorescent or phosphorescent species. The
analysis of a sample containing n components,
therefore, can
be accomplished by measuring the
total emission intensity at n wavelengths.
Time, Cost, and Equipment
As
with other optical
spectroscopic methods, fluores- cent and phosphorescent methods
provide a rapid
means of analysis
and are capa- ble of automation. Fluorometers are
relatively inexpensive, ranging from several
hundred to several thousand dollars,
and often are very satisfactory for quantitative
work. Spectrofluorometers are more expensive, with some models costing as much
as $50,000.
Related Topics