Chapter: Modern Analytical Chemistry: Equilibrium Chemistry
Ladder Diagrams for Complexation Equilibria
Ladder Diagrams for Complexation Equilibria
The same principles used in constructing and interpreting ladder
diagrams for acid–base equilibria can be applied to equilibria
involving metal–ligand com- plexes. For complexation reactions
the ladder diagram’s
scale is defined
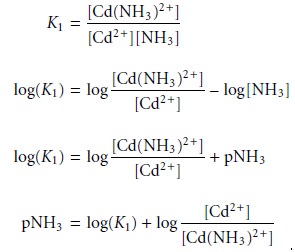
by the concentration of uncomplexed, or free ligand, pL. Using the formation of Cd(NH3)2+ as an example
we can easily show that the dividing line between the
predominance regions for Cd2+ and Cd(NH3)2+ is log(K1).
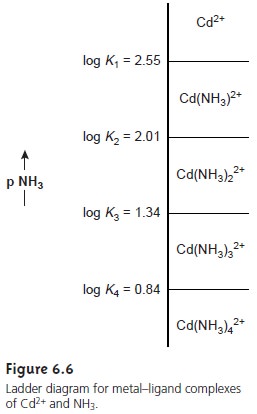
Since K1 for Cd(NH3)2+ is 3.55 ´ 102,
log(K1) is 2.55. Thus, for a pNH3 greater than 2.55
(concentrations of NH3 less than 2.8 x 10⁻³ M), Cd2+
is the predominate species. A complete ladder diagram for the metal–ligand
complexes of Cd2+ and NH3 is shown in Figure 6.6.
We can also construct ladder
diagrams using cumulative formation constants
in place of stepwise formation constants. The first
three stepwise formation con- stants for the reaction of Zn2+ with NH3
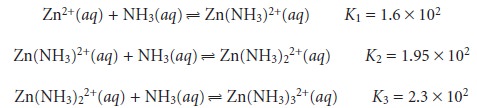
show that the formation of Zn(NH3)32+ is more favorable than the formation of Zn(NH3)2+ or Zn(NH3)22+. The equilibrium, therefore, is best represented by the cumulative
formation reaction
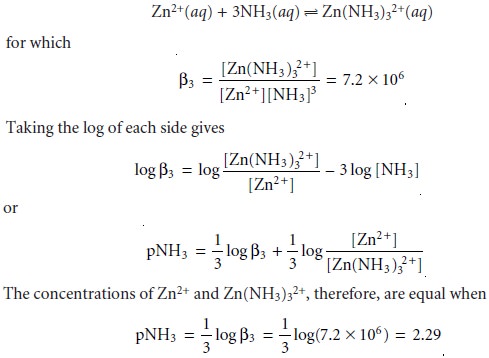
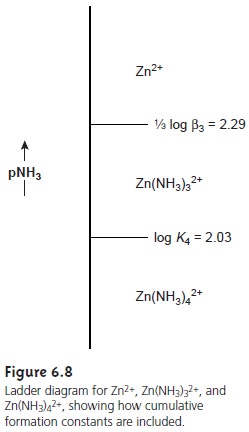
A complete ladder
diagram for the Zn2+–NH3 system
is shown in Figure 6.8.
Related Topics