Chapter: 11th 12th std standard Class Physics sciense Higher secondary school College Notes
Graphical representations - displacement, velocity,acceleration with time graph
Graphical representations
The graphs provide a convenient method to
present pictorially, the basic informations about a variety of events. Line
graphs are used to show the relation of one quantity say displacement or
velocity with another quantity such as time.
If the displacement, velocity and acceleration
of a particle are plotted with respect to time, they are known as,
1. displacement ? time graph (s - t graph)
2. velocity ? time graph (v - t graph)
3. acceleration ? time graph (a - t graph)
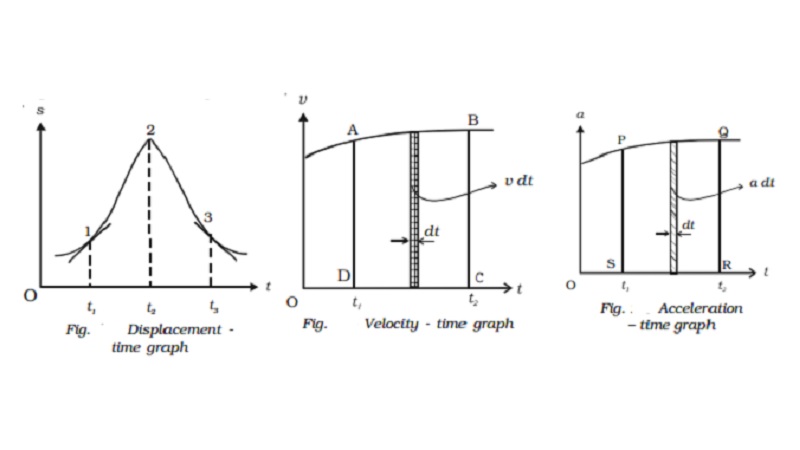
Displacement ? time graph
When the displacement
of the particle is plotted as a function of time, it is displacement - time graph.
As v = ds/dt , the slope of the s - t graph at
any instant gives the velocity of the particle at that instant. In Fig. 2.4 the
particle at time t1, has a positive velocity, at time t2, has zero velocity and
at time t3, has negative velocity.
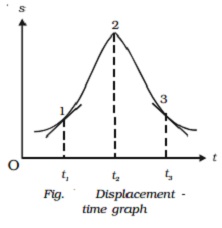
Velocity
? time graph
When the velocity of the particle is plotted as
a function of time, it is velocity-time graph.
As a = dv/dt , the slope of the v ? t curve at
any instant gives the acceleration of the particle (Fig. 2.5).
But v=ds/dt or
Ds = v dt
If the displacements are s1 and s2
in times t1 and t2 then
∫12ds = ∫ t1t2
vdt
S2-s1 = ∫t1t2vdt
= area ABCD
The area under the v ? t curve, between the
given intervals of time, gives the change in displacement or the distance
travelled by the particle during the same interval.
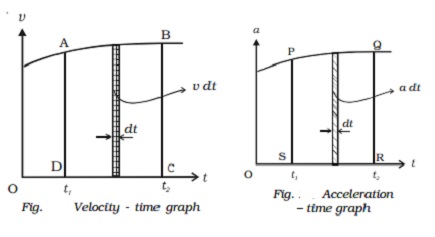
Acceleration
? time graph
When the acceleration is plotted as a function
of time, it is acceleration ? time graph (Fig. 2.6).
A=dv/dt
Or dv = adt
If the velocities are v1 and v2
at times t1 and t2 respectively, then
∫v1v2 dv = ∫t1t2
a dt
V2-v1 = ∫t1t2adt
= area PQRS
The area under the a ? t curve, between the
given intervals of time, gives the change in velocity of the particle during
the same interval. If the graph is parallel to the time axis, the body moves
with constant
acceleration.
Related Topics