Chapter: 11th 12th std standard Class Physics sciense Higher secondary school College Notes
Spectral series of hydrogen atom and Energy level diagram
Spectral
series of hydrogen atom
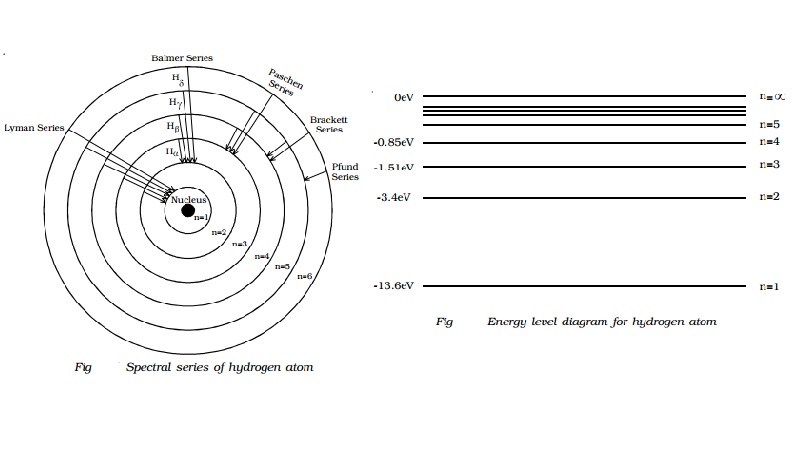
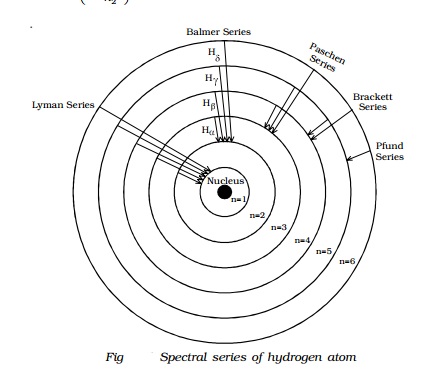
Whenever an electron in a hydrogen atom jumps
from higher energy level to the lower energy level, the difference in energies
of the two levels is emitted as a radiation of particular wavelength. It is
called a spectral line. As the wavelength of the spectral line depends upon the
two orbits (energy levels) between which the transition of electron takes
place, various spectral lines are obtained. The different wavelengths
constitute spectral series which are the characteristic of the atoms emitting
them. The following are the spectral series of hydrogen atom.
(i) Lyman series
When the electron jumps from any of the outer
orbits to the first orbit, the spectral lines emitted are in the ultraviolet
region of the spectrum and they are said to form a series called Lyman series
(Fig).
Here, n1 = 1, n2 = 2,3,4 �
The wave number of the Lyman series is given by,
v = R(1- (1/n22) )
(ii) Balmer series
When the electron jumps from any of the outer
orbits to the second orbit, we get a spectral series called the Balmer series.
All the lines of this series in hydrogen have their wavelength in the visible
region. Here n1=2, n2 = 3,4,5 �
The wave number of the Balmer series is,
v = R( 1/22 - 1/n22
) = R( � - 1/n22 )
The first line in this series (n2 =
3), is called the Hα-line, the second (n2=4), the Hβ-line and so on.
(iii) Paschen series
This series consists of all wavelengths which
are emitted when the electron jumps from outer most orbits to the third orbit.
Here n2 = 4,5,6 � and n1 = 3. This series is in the
infrared region with the wave number given by
v = R( 1/32 - 1/n22
) = R( 1/9 - 1/n22
)
(iv) Brackett series
The series obtained by the transition of the
electron from n2 = 5, 6... to n1 = 4 is called Brackett
series. The wavelengths of these lines are in the infrared region. The wave
number is,
v = R( 1/42 - 1/n22
) = R( 1/16 - 1/n22
)
(v) Pfund series
The lines of the series are obtained when the
electron jumps from any state n2 = 6, 7... to n1=5. This
series also lies in the infrared region. The wave number is,
v = R( 1/52 - 1/n22
) = R( 1/25 - 1/n22
)
Energy level diagram
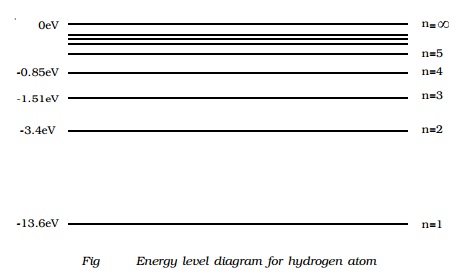
The energy of the electron in the nth orbit of the
hydrogen atom is given by,
En = -13.6 /n2 eV
Energy associated with the first orbit of the hydrogen atom is,
E1 = -13.6 /12 = -13.6
eV
It is called ground state energy of the hydrogen atom. Energy
associated with the second orbit is given by,
E2 = -13.6 /22 = -3.4
eV
It is called energy of first excited state of
the hydrogen atom. The energy of second, third, fourth, � excited states of the
hydrogen atom are, E3 = -1.51 eV, E4 = -0.85 eV, E5
= -0.54eV ...
when n =infinity ∞, Einf = -13.6
/ inf2 = 0
Therefore, it is seen from the above values,
that, the energy associated with a state becomes less negative and approaches
closer and closer to the maximum value zero corresponding to n = ∞inf.
Taking these energies on a linear scale, horizontal lines are drawn
which represent energy levels of the hydrogen atom (Fig). This diagram is known
as energy level diagram.
Sodium and mercury spectra
The sodium vapour lamp is commonly used in the
laboratory as a source of monochromatic (single colour) light. Sodium vapour
lamps and mercury lamps have been used for street lighting, as the two lamps
give a more intense light at comparatively low cost. The mercury light is a
composite light consisting of all colours in the visible spectrum. The
wavelength of prominent lines emitted by the mercury source is presented in
Table 6.1. The two lamps work on the principle of hot cathode positive column.
Since, sodium and mercury atoms are in the vapour state, they emit line
spectra. The sodium vapour lamp emits yellow light of wavelength 5896� and
5890�. These lines are called sodium D1 and D2 lines.
List :
Wavelength of spectral lines emitted by mercury
Colour Wavelength (nm)
Violet I 398
Violet II 403
Blue 436
Bluish Green I 492
Bluish Green II 496
Green 546
Yellow I 577
Yellow II 579
Orange 609
Red 625
Related Topics