Chapter: Modern Analytical Chemistry: Equilibrium Chemistry
Ladder Diagram for Oxidation–Reduction Equilibria
Ladder Diagram for Oxidation–Reduction
Equilibria
Ladder diagrams can
also be used
to evaluate equilibrium reactions in redox
sys- tems. Figure 6.9 shows a typical ladder
diagram for two half-reactions in which
the scale is the electrochemical potential, E. Areas of predominance are defined by the
Nernst equation. Using
the Fe3+/Fe2+
half-reaction as an example, we write
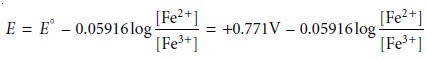
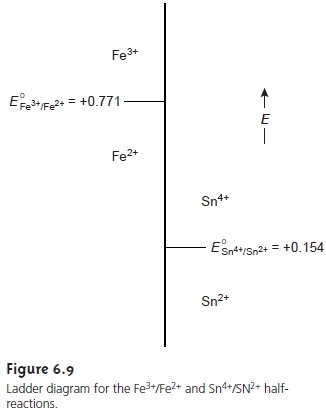
For potentials more positive than the standard-state potential, the predominate species is Fe3+, whereas
Fe2+ predominates for potentials more negative than E°. When coupled with the step for the Sn4+/Sn2+ half-reaction, we see that Sn2+ can be used to reduce
Fe3+. If an excess
of Sn2+
is added, the potential of the resulting solu- tion will be near +0.154 V.
Using standard-state potentials to construct a ladder diagram
can present problems if solutes are not at their standard-state concentra- tions. Because the concentrations of the reduced
and oxidized species are in a logarithmic term,
deviations from standard-state concentra-
tions can usually be ignored
if the steps being compared
are separated by at least 0.3 V.1b A
trickier problem occurs
when a half-reaction’s po-
tential is affected by the concentration of another species.
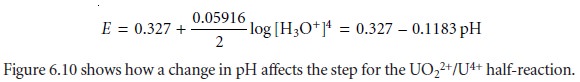
For example, the potential for the following half-reaction

depends on the
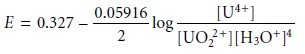
pH of the solution. To define areas
of predominance in this
case, we begin
with the Nernst
equation
and factor out the concentration of H3O+.
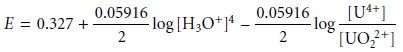
From this equation we see that the areas of predominance for UO22+ and U4+ are defined
by a step whose potential is
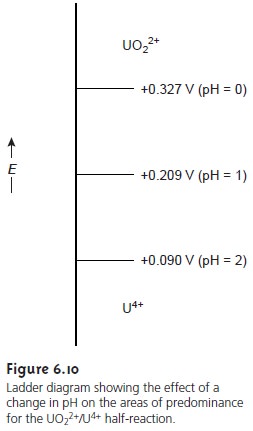
Related Topics