Chapter: Civil : Structural dynamics of earthquake engineering
Response spectrum characteristics
Response spectrum characteristics
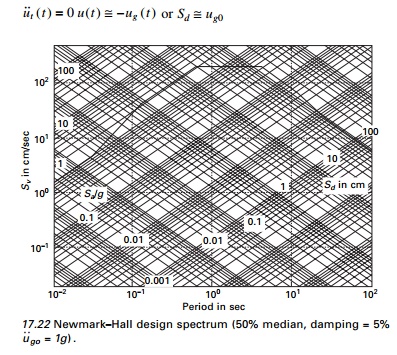
Let u˙˙g
0 , u˙ g 0 , ug
0 be the peak values of ground acceleration, velocity and
displacement respectively. Response spectrum values are presented to normalized
form in Fig. 17.22. The period range may be separated by period values at a,
b, c, d, e and f where Ta
= 0.033 s, Tb = 0.125 s, Te = 10 s, Tf
= 33 s.
We identify the effects of
damping on systems with short period Tn < Ta
= 0.033, the peak-pseudo acceleration A = Spa
approaches u˙˙g 0 and D = Sd
is very small. For a fixed mass, very short period means extremely stiff or
essentially rigid. Deformation will be very small and it moves with the ground.
For a system with longer period Sd with
approach to ug0, Spa is very
small. For a rigid mass the structure is flexible. In that case
For short period system TnTa
< Tn < Tc. Spa
exceeds u˙˙g 0 with amplification
depending on Tn, Žü over a period range Tb to Tc,
Spa may be constant = u˙˙g 0
├Ś amplification factor depending on Žü .
For a long period Td
< Tn < Tf, Sd
generally exceeds ug0 with amplification generally
depending on Žü. Over a
portion of the period Td to Te(3ŌĆō10 s) Sd
may be idealized as a constant ├Ś
amplification factor depending on Žü. For intermediate period systems with Tn
between Tc < Tn < Td,
Spv exceeds u˙g 0
Over the period range Spv may be idealized as a constant
value ├Ś amplification factor depending on Žü.
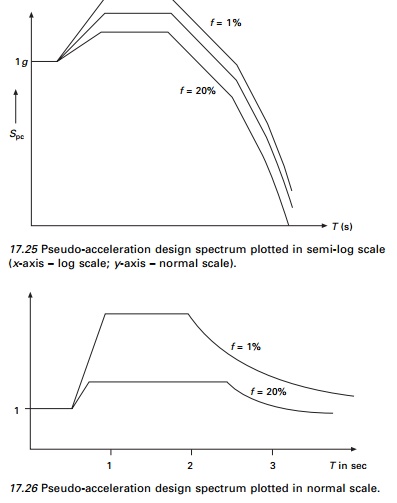
Based on the observation of
response spectrum, it is logical to divide the spectrum into three ranges:
ŌĆó Long
period range Tn > Td.
Displacement-sensitive region because structure response is related
mostly to ground displacement.
ŌĆó Short
period range Tn < Tc.
Acceleration-sensitive region because structural response is mostly
related to ground acceleration.
ŌĆó Intermediate
range Tc < Tn
< Td. Velocity-sensitive region because structural
response appears to be better related to ground velocity than to other ground
motion parameters.
The periods Ta,
Tb, Te, Tf on the
idealized spectrum are independent of damping but Tc and Td
vary with damping.
Idealizing a spectrum by a series
of straight lines a, b, c, d, e, f in
the four-way logarithmic plot is obviously not a precise process. The period
values at aŌĆōf and amplification factors are judgemental. The
advantages of an idealized spectrum are that we can very easily
construct a design spectrum. These values vary from one ground motion with
others.
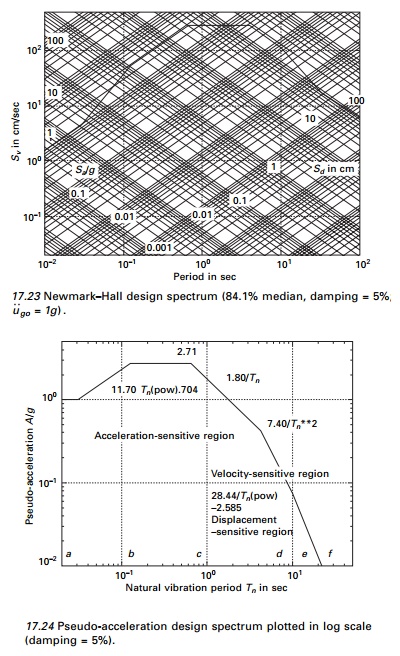
Example 17.7
Consider an elastic design
spectrum, 84.1% for ground motion u˙˙g 0
= 1 g ; u˙g
0 = 121.92 cm/s; ug0 = 91.44 cm; Žü = 5%. Using the program
developed it is possible to construct a design spectrum as shown in Fig. 17.23.
Solution
From Fig. 17.23, we can construct
a pseudo-acceleration spectrum in terms of g plotted in log scale in
Fig. 17.24 for ground acceleration of 1g and damping factor 5%.
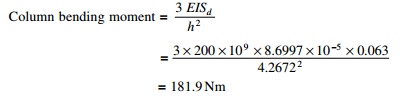
Similarly for various values of Žü an elastic pseudo-acceleration spectrum can be plotted in log
scale as shown in Fig. 17.25 and a design spectrum in Fig. 17.26. If
pseudo-acceleration is plotted at a normal scale, the diagram is as shown in
Fig. 17.26.
Example 17.8
Estimate the maximum sensitive response for the industrial
building of Example 17.1 using NewmarkŌĆōHall design spectra for an anticipated
ground acceleration
of 0.308g and for a
damping factor of 0.05. Compare the results with the maximum response obtained
from time history analysis.
Solution
Damping = 5%
(i) NS
direction, T = 0.567 s
From chart (see Fig. 17.23), spectra value Sd
= 6.35 cm; Spv = 71.12 cm/s; Spa = 784.35
cm/s2.
Maximum
base shear = mSpa
= 131 697.2
├Ś 7.843
1032.9 kN
(ii)
EW direction Sd = 20 mm
Spv = 393.7 mm/s Spa
= 7.843 mm/s2 Žēn = 20 rad/s
T = 0.313
Maximum base shear = mSpa
= 1032.9 kN
Comparison of the maximum
response obtained from time history analysis response spectra and design
spectrum analysis is presented in Table 17.4 for NS direction. There is a
considerable discrepancy between the results of response spectrum and design
spectrum. The former represents the response to a specific earthquake while the
latter represents predicted response to any earthquake.
Related Topics