Chapter: Civil : Structural dynamics of earthquake engineering
Response spectra
Distinction between design and response
spectra
A design spectrum conceptually differs from a response
spectrum in two ways. A response spectrum is a jagged plot of peak response of
all possible
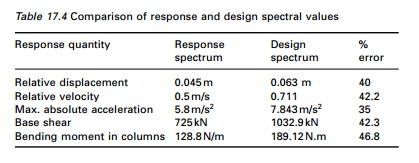
SDOF systems, and hence is a
description of a particular ground motion. A design spectrum is smooth and is
the envelope of the different elastic design spectra. Figure 17.27 shows a
design spectrum as the envelope of design spectra for earthquakes originating
on the different faults. The conceptual differences between the response
obtained from the response spectrum and design spectrum are demonstrated in
Fig. 17.27. In this figure, notice that for some periods these values obtained
for response and design spectra are the same, and for some other periods there
is a considerable discrepancy. In general, the response spectrum and the design
spectrum do not yield the same result since the former represents the response
to a specific earthquake, while the latter represents only the predicted
response to an earthquake having the same PGA (peak ground acceleration).
Response spectrum
1Acceleration, velocity and displacement spectrum
With the pseudo-velocity design
spectrum (see Fig. 17.28), the pseudo-acceleration design spectrum and
deformation design spectrum are determined from the equation
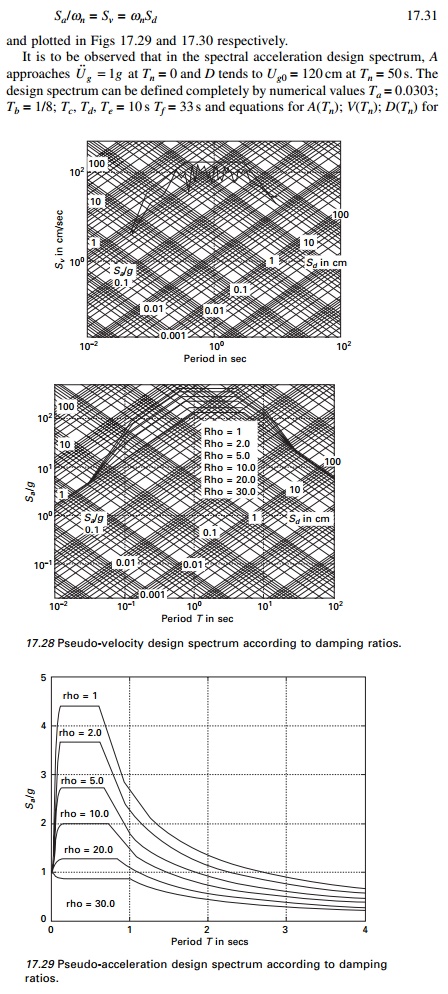
each branch of the spectra. Out of six periods, four of them
in Ta; Tb; Te; Tf
are fixed but the others Tc; Td depend on
damping. Equations describing various branches of the pseudo-acceleration
design spectrum are given in Fig. 17.23. Observe that the pseudo-acceleration
design spectrum for 84.1%
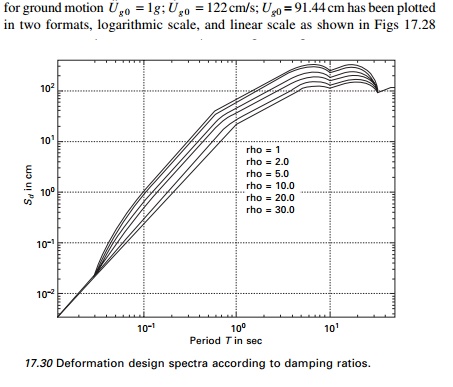
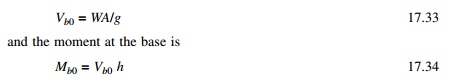
and 17.29. The two plots include
spectrum values for six different damping values 1%, 2% , 5%, 10%, 20% and 30%
respectively. Scaling the spectrum by ╬Ę is the simplest way to obtain design spectra for ground
motion of 
2Peak structural response from spectrum
It is possible to get a peak
response of SDOF from the response spectrum without computing the response
history. Corresponding to the natural vibration period Tn and
damping ratio Žü, the
values of D, V and A are read from the spectrum of Fig.
17.23.
Peak values of elastic static force fs0
fs0 = mA =
kD = mg(a/g) = WA/g --- ---- 17.32
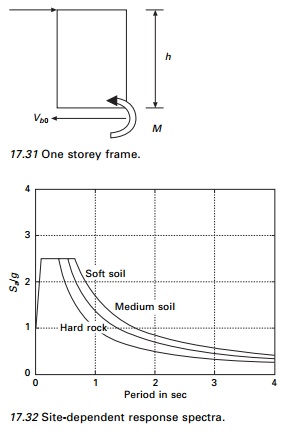
For a one storey structure shown in Fig. 17.31 the base shear
is calculated as
Base shear can be obtained out of the D, V, A
spectrum. One of D, V, A needs to be obtained in
structural design.
Site-specific
response spectra
The design spectra such as those
presented above were based on earthquake records on alluvium and did not
consider soil condition as a parameter. It is concluded from various studies
that soil condition at a site significantly affects the amplifications and
shapes as illustrated in Fig. 17.32. Thus the ground motions near the surface
where a structure may be located are affected by the properties of the soil
(e.g., stiffness, strength and layering) and the rock strata between the site
and the source. The available data suggest that there is a major difference
between spectral amplification factors calculated on soft soils and those
calculated in competent rock. In relatively soft soils, spectral specifications
vary with the frequency and intensity of ground motion, and spectral velocities
and accelerations may be twice those of competent rock. In extremely soft soil
the accelerations may decrease slightly but spectral displacements and
velocities may increase by a factor of 2 compared with the rock.
To account for variability in the
soil condition at the site in an approximate
manner, modification factors for the spectral amplification factors are
presented in Table 17.5. For especially important structures or where local
conditions are not amenable to simple classification, the use of smooth spectra
curves is inadequate. In such cases, site-specific studies are performed to
determine more precisely the expected intensity and character of seismic
motion. It is necessary to be aware of the procedure used in the generation of
site-specific response spectra. At a site, the maximum capable earthquake
(MCE) is selected as the largest earthquake reasonably likely to occur. The
slip rates of the faults are eliminated with some probability. Using a
statistical approach the peak ground acceleration, velocity and displacement
values are estimated at a site. By applying structure amplification factors to
these values the spectral bounds are obtained for each desired value of
spectral damping. The ground motion values for a given site thus vary with the
magnitude of the earthquake and the distance of the site from the point of
energy release. These values provide the basis for developing site-dependent
response spectrum curves as shown in Fig. 17.32.
Related Topics