Chapter: Biotechnology Applying the Genetic Revolution: Genomics and Gene Expression
Physical Maps Use Sequence Data
PHYSICAL
MAPS USE SEQUENCE DATA
Genetic markers such as SNPs,
VNTRs, RFLPs, and microsatellites are useful, but for large genomes like the
human genome, these still do not provide enough markers. The map builders
needed other types of markers, such as sequence
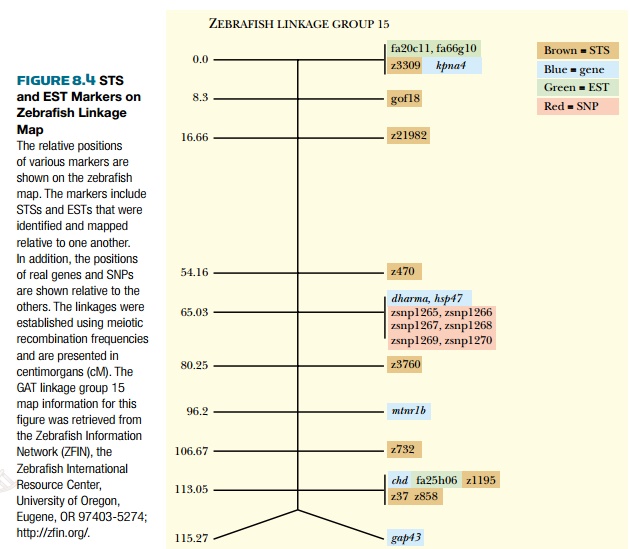
tagged sites (STSs) (Fig. 8.4). These are simply short sequences of 100–500
base pairs that are unique and can be detected by PCR. A specialized type of
STS is the expressed sequence tag (EST),
so called because it was identified in a cDNA library. This means that the EST
is expressed as mRNA. These small pieces of sequence data are just portions of
larger genes; therefore, many different ESTs may be found for one single gene.
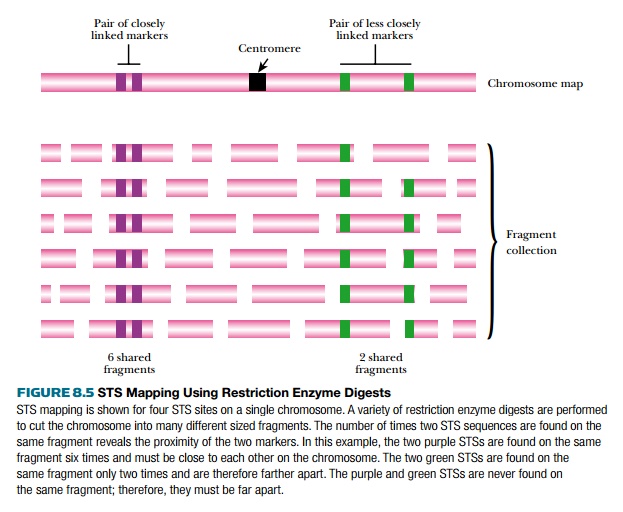
Mapping physical markers resembles linkage analysis for genes in the sense that the closer they are, the more likely they will remain together. However, linkage for physical markers is determined by restriction enzyme digestion (Fig. 8.5). Either entire genomes or single large clones from a library are digested with a variety of different restriction enzymes. Each enzyme will digest the DNA into different sized fragments, which are then probed for several different STS or EST markers. If two markers are close together, they will often be found on the same restriction fragment, but if they are far apart, they will be on different fragments. The fragment sizes are determined, and from this the approximate distance between two markers can be estimated.
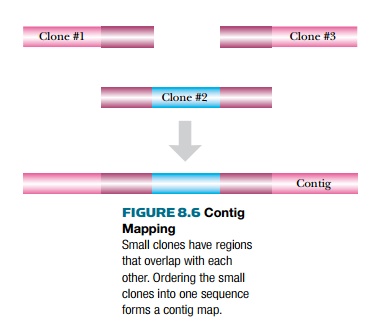
One library clone will often
overlap with another when many different clones from one genome are compared.
The overlap region has identical sequence and, therefore, identical restriction
enzyme sites, identical STS markers, and identical ESTs. Contig maps compare the overlapping regions, thus ordering the
clones into a longer linear segment, known as a contig (Fig. 8.6). As more and more clones are analyzed, the contig
gets longer and longer, producing
large segments of chromosomes.
Related Topics