Chapter: 11th 12th std standard Class Organic Inorganic Physical Chemistry Higher secondary school College Notes
Variation Of Equivalent Conductance With Concentration
VARIATION
OF EQUIVALENT CONDUCTANCE WITH CONCENTRATION
The effect of concentration on equivalent
conductance can be studied from the plots of λC values versus square root of concentration of
the electrolyte. By doing so, it has been found that different types of plots
are obtained depending on the nature of electrolyte. For strong electrolytes lC decreases linearly
with increase in sq.root C while for weak electrolytes, there is a
curve type of non linear decrease of lC with sq.root C .
For strong
electrolytes Debye, Huckel and Onsager equation can be applied.
λC = λ¥ - (A + B λ¥ ) sq-rt C to the linear plot of lC versus sq.rt (C ) for strong electrolytes, the intercept value equals to λ¥ value which is obtained by extrapolating the line to 'y' axis ( C
= 0). The slope value equals to (A + B λ¥). A and B
are called as Debye constants for strong electrolytes.
In case of weak electrolytes, degree of
dissociation (a) increases when concentration decreases. Hence,
(1 - a) value tends to zero at infinite dilution, such that λC increases and tends
to λ¥ value.
λ¥ of weak electrolytes are experimentally obtained by extrapolating the upper arm of the curve to the Y axis and the intercept value
corresponds to λ¥. In the intermediate concentration range, λC is lower than λ¥ since the weak electrolyte exists in partially ionised state. The
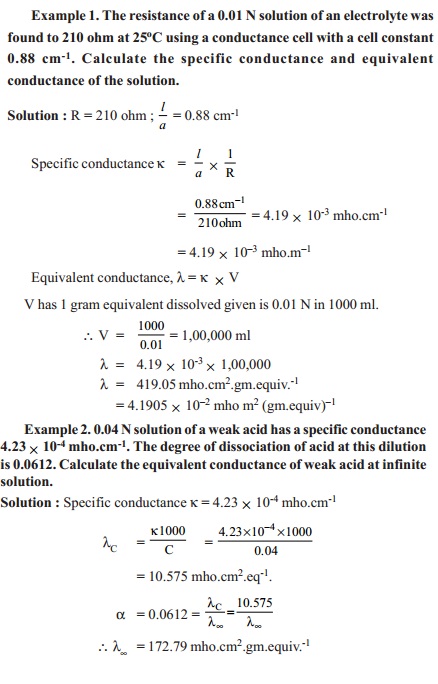
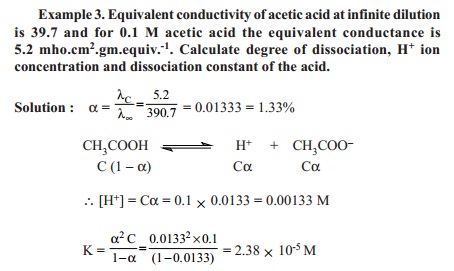
degree of dissociation a equals to the ratio of λC to λ¥ value.
(i.e., a = λC / λ¥).


Related Topics