Chapter: Biochemistry: The Behavior of Proteins: Enzymes
The MichaelisŌĆōMenten Approachto Enzyme Kinetics
The MichaelisŌĆōMenten Approachto
Enzyme Kinetics
A particularly useful model for the kinetics of
enzyme-catalyzed reactions was devised in 1913 by Leonor Michaelis and Maud
Menten. It is still the basic model for nonallosteric enzymes and is widely
used, even though it has undergone many modi├×cations.
A typical reaction might be the conversion of
some substrate, S, to a product, P. The stoichiometric equation for the reaction
is
S - > P
The mechanism for an enzyme-catalyzed reaction
can be summarized in the form

Note the assumption that the product is not
converted to substrate to any appreciable extent. In this equation, k1 is the rate constant for
the formation of the enzyme-substrate complex, ES, from the enzyme, E, and the
substrate, S; k-1 is the
rate constant for the reverse reaction, dissociation of the ES complex to free
enzyme and substrate; and k2
is the rate constant for the conversion of the ES complex to product P and the
subsequent release of product from the enzyme. The enzyme appears explicitly in
the mechanism, and the concentrations of both free enzyme, E, and enzyme-substrate
complex, ES, therefore, appear in the rate equations. Catalysts
characteristically are regenerated at the end of the reaction, and this is true
of enzymes.
When we measure the rate (also called the
velocity) of an enzymatic reaction at varying substrate concentrations, we see
that the rate depends on the substrate concentration, [S]. We measure the
initial rate of the reaction (the rate mea-sured immediately after the enzyme
and substrate are mixed) so that we can be certain that the product is not
converted to substrate to any appreciable extent. This velocity is sometimes
written Vinit or V0 to indicate this initial
velocity, but it is important to remember that all the calculations involved in
enzyme kinetics assume that the velocity measured is the initial velocity. We
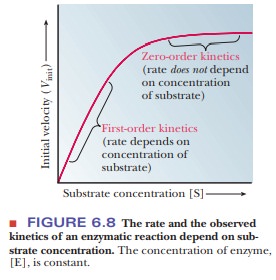
can graph our results as in Figure 6.8. In the lower region of the curve (at
low levels of substrate), the reaction is first order, implying that the
velocity, V, depends on substrate
concentration [S]. In the upper portion of the curve (at higher levels of
substrate), the reaction is zero order; the rate is independent of
concentration. The active sites of all of the enzyme molecules are saturated.
At infinite substrate concentration, the reaction would proceed at its maximum
velocity, written Vmax
The substrate concentration at which the
reaction proceeds at one-half its maximum velocity has a special significance.
It is given the symbol KM,
which can be considered an inverse measure of the affinity of the enzyme for
the substrate. The lower the KM,
the higher the affinity.
Let us examine the mathematical relationships
among the quantities [E], [S], Vmax,
and KM. The general
mechanism of the enzyme-catalyzed reaction involves binding of the enzyme, E,
to the substrate to form a complex, ES, which then forms the product. The rate
of formation of the enzyme-substrate complex, ES, is

where Ōłå[ES]/ Ōłåt means the change in the concentration of the
complex, Ōłå [ES], during a given time Ōłåt, and k1
is the rate constant for the formation of the complex.
The ES complex breaks down in two reactions, by
returning to enzyme and substrate or by giving rise to product and releasing
enzyme. The rate of disap-pearance of complex is the sum of the rates of the
two reactions.

The negative sign in the term - Ōłå [ES]/ Ōłå t means that the
concentration of the complex decreases as the complex breaks down. The term k-1 is the rate constant for
the dissociation of complex to regenerate enzyme and substrate, and k2 is the rate constant for
the reaction of the complex to give product and enzyme.
Enzymes are capable of processing the substrate
very efficiently, and a steadystate is
soon reached in which the rate of formation of the enzyme-substratecomplex
equals the rate of its breakdown. Very little complex is present, and it turns
over rapidly, but its concentration stays the same with time. According to the steady-state theory, then, the rate of
formation of the enzyme-substrate complex equals the rate of its breakdown,

To solve for the concentration of the complex,
ES, it is necessary to know the concentration of the other species involved in
the reaction. The initial concen-tration of substrate is a known experimental
condition and does not change sig-nificantly during the initial stages of the
reaction. The substrate concentration is much greater than the enzyme
concentration. The total concentration of the enzyme, [E]T, is also
known, but a large proportion of it may be involved in the complex. The
concentration of free enzyme, [E], is the difference between [E]T,
the total concentration, and [ES], which can be written as an equation:

where KM
is called the Michaelis constant. It
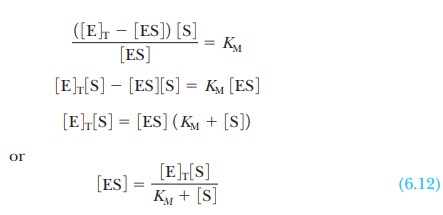
is now possible to solve Equation 6.11 for the concentration of enzyme-substrate
complex:
In the initial stages of the reaction, so
little product is present that no reverse reaction of product to complex need
be considered. Thus the initial rate determined in enzymatic reactions depends
on the rate of breakdown of the enzyme-substrate complex into product and
enzyme. In the Michaelis-Menten model, the initial rate, V, of the formation of product depends only on the rate of the
breakdown of the ES complex,

and on the substitution of the expression for
[ES] from Equation 6.12,

If the substrate concentration is so high that
the enzyme is completely saturated with substrate ([ES] = [E]T), the
reaction proceeds at its maximum possible rate (Vmax). Substituting [E]T for [ES] in Equation
6.13,

The total concentration of enzyme is a
constant, which means that

This expression for Vmax resembles
that for a zero-order reaction given in Equation 6.3:

Note that the concentration of substrate, [A],
appears in Equation 6.3 rather than the concentration of enzyme, [E], as in
Equation 6.15. When the enzyme is saturated with substrate, zero-order kinetics
with respect to substrate are observed.
Substituting the expression for Vmax into Equation 6.14
enables us to relate the observed velocity at any substrate concentration to
the maximum rate of an enzymatic reaction:

Figure 6.8 shows the effect of increasing
substrate concentration on the observed rate. In such an experiment, the
reaction is run at several substrate concentrations, and the rate is determined
by following the disappearance of reactant, or the appearance of product, by
way of any convenient method. At low-substrate concentrations, first-order
kinetics are observed. At higher sub-strate concentrations (well beyond 10 ├Ś KM), when the enzyme is
saturated, the constant reaction rate characteristic of zero-order kinetics is
observed.
This constant rate, when the enzyme is
saturated with substrate, is the Vmax
for the enzyme, a value that can be roughly estimated from the graph. The value
of KM can also be
estimated from the graph. From Equation 6.16,

When experimental conditions are adjusted so
that [S] = KM,

In other words, when the rate of the reaction
is half its maximum value, the substrate concentration is equal to the
Michaelis constant (Figure 6.9). This fact is the basis of the graphical
determination of KM.
Note that the reaction used to generate the
Michaelis-Menten equation was the simplest enzyme equation possible, that with
a single substrate going to a single product. Most enzymes catalyze reactions
containing two or more substrates. This does not invalidate our equations,
however. For enzymes with multiple substrates, the same equations can be used,
but only one substrate can be studied at a time. If, for example, we had the
enzyme-catalyzed reaction

we could still use the Michaelis-Menten
approach. If we hold A at saturating levels and then vary the amount of B over
a broad range, the curve of velocity versus [B] will still be a hyperbola, and
we can still calculate the KM
for B. Conversely, we could hold the level of B at saturating levels and vary
the amount of A to determine the KM
for A. There are even enzymes that have two substrates where, if we plot V versus [substrate A], we see the
Michaelis-Menten hyperbola, but, if we plot V
versus [substrate B], we see the sigmoidal curve shown for aspartate
transcarbamoylase in Figure 6.7. Technically the term KM is appropriate only for enzymes that exhibit a
hyperbolic curve of velocity versus [substrate].
How do we calculate KM and Vmax from a graph?
The curve that describes the rate of a
nonallosteric enzymatic reaction is hyperbolic. It is quite dif├×cult to
estimate Vmax because it
is an asymptote, and the value is never reached with any ├×nite substrate
concentration that we could use in the lab. This, in turn, makes it dif├×cult to
determine the KM of the
enzyme. It is considerably easier to work with a straight line than a curve.
One can transform the equation for a hyperbola (Equation 6.16) into an equation
for a straight line by taking the reciprocals of both sides:
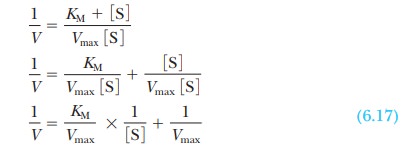
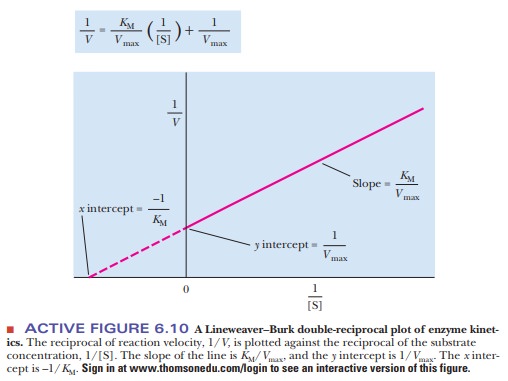
The equation now has the form of a straight
line, y = mx + b, where 1/V takes the place of the y coordinate and 1/[S] takes the place
of the x coordinate. The slope of the
line, m, is KM/Vmax,
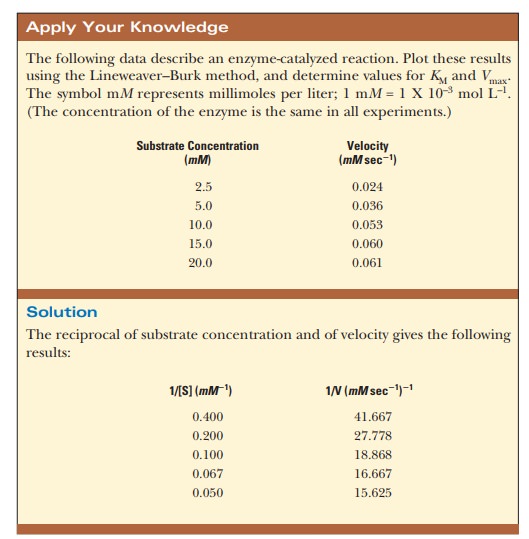
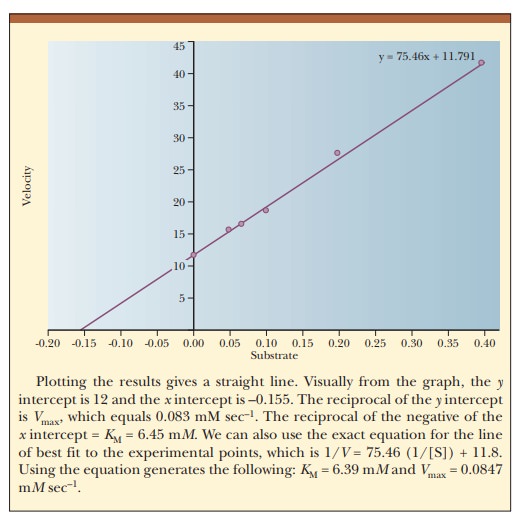
and the y intercept, b, is 1/Vmax. Figure 6.10 presents this information graphically
as a LineweaverŌĆōBurk double-reciprocal
plot. It is usually easier to draw the best straight line through a set of
points thanto estimate the best ├×t of points to a curve. Convenient computer
methods exist for drawing the best straight line through a series of experimental
points. Such a line can be extrapolated to high values of [S], ones that might
be unattainable because of solubility limits or the cost of the substrate. The
extrapolated line can be used to obtain Vmax.
What is the significance of KM and Vmax?
We have already seen that when the rate of a
reaction, V, is equal to half the
maximum rate possible, V = Vmax/2, then KM = [S]. One interpretation
of the Michaelis constant, KM,
is that it equals the concentration of substrate at which 50% of the enzyme
active sites are occupied by substrate. The Michaelis constant has the units of
concentration.
Another interpretation of KM relies on the
assumptions of the original Michaelis-Menten model of enzyme kinetics. Recall
Equation 6.4:

As before, k1
is the rate constant for the formation of the enzyme-substrate complex, ES,
from the enzyme and substrate; k-1
is the rate constant for the reverse reaction, dissociation of the ES complex
to free enzyme and substrate; and k2
is the rate constant for the formation of product P and the subsequent release
of product from the enzyme. Also recall from Equation 6.11 that

Consider the case in which the reaction E + S -
> ES takes place more frequently than ES - > E + P. In kinetic terms,
this means that the dissociation rate constant k-1is greater than the rate constant for the formation
of product, k2. If k-1is much larger than k2
(k-1>>k2), as was originally
assumed by Michaelis and Menten, then approximately

It is informative to compare the expression for
the Michaelis constant with the equilibrium constant expression for the
dissociation of the ES complex,

The k
values are the rate constants, as before. The equilibrium constant expression
is

This expression is the same as that for KM and makes the point that,
when the assumption that k-1>>k2 is valid, KM is simply the dissociation
constant for the ES complex. KM
is a measure of how tightly the substrate is bound to the enzyme. The greater
the value of KM, the less
tightly the substrate is bound to the enzyme. Note that in the steady-state
approach, k2 is not
assumed to be small compared with k-1;
therefore, KM is not
technically a dissociation constant, even though it is often used to estimate
the af├×nity of the enzyme for the substrate.
Vmaxis related to theturnover
numberof an enzyme, a quantity equal to thecatalytic constant, k2. This constant is also
referred to as kcat or kp:

The turnover number is the number of moles of
substrate that react to form product per mole of enzyme per unit time. This
statement assumes that the enzyme is fully saturated with substrate and thus
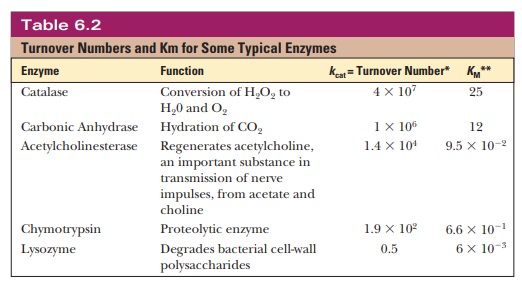
that the reaction is proceeding at the maximum rate. Table 6.2 lists turnover
numbers for typical enzymes, where the units are per second.
Turnover numbers are a particularly dramatic
illustration of the efficiency of enzymatic catalysis. Catalase is an example
of a particularly efficient enzyme. We encountered catalase in its role in
converting hydrogen peroxide to water and oxygen. As Table 6.2 indicates, it
can transform 40 mil-lion moles of substrate to product every second.
Related Topics