with Answer, Solution | Applied Statistics - Statistical Quality Control (SQC): Example Solved Problems | 12th Business Maths and Statistics : Chapter 9 : Applied Statistics
Chapter: 12th Business Maths and Statistics : Chapter 9 : Applied Statistics
Statistical Quality Control (SQC): Example Solved Problems
Example
9.19
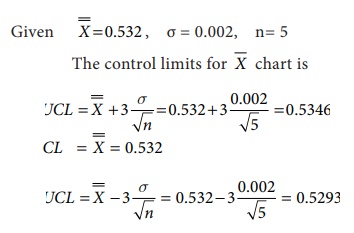
A machine drills hole in
a pipe with a mean diameter of 0.532 cm and a standard deviation of 0.002 cm.
Calculate the control limits for mean of samples 5.
Solution:
Example
9.20
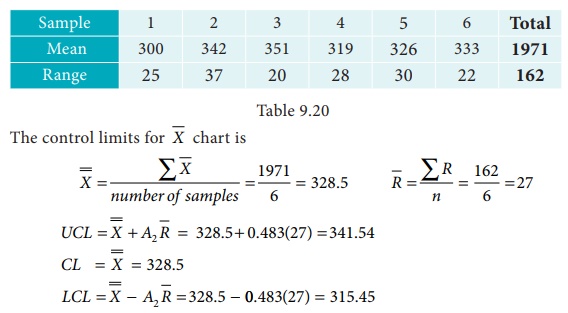
The following data gives
the readings for 8 samples of size 6 each in the production of a certain
product. Find the control limits using mean chart.

Given for n = 6, A2 =
0.483,
Solution:
Example
9.21
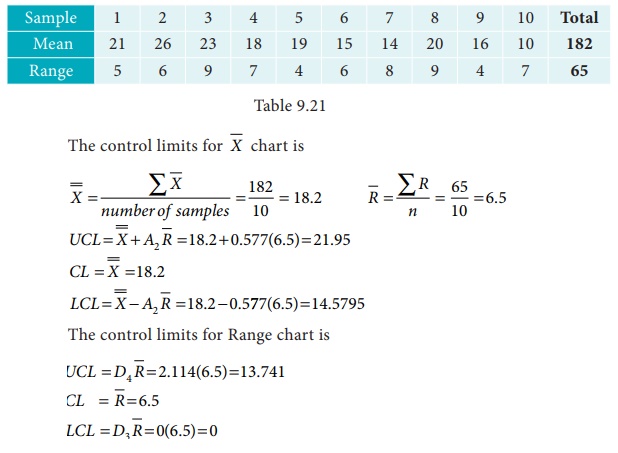
The data shows the
sample mean and range for 10 samples for size 5 each. Find the control limits
for mean chart and range chart.

Solution:
Example
9.22
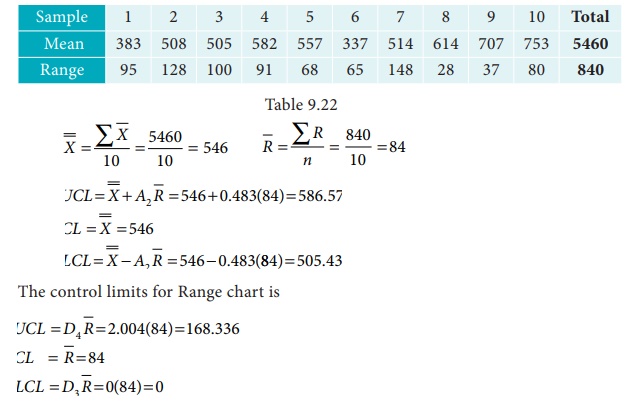
The following data gives
readings of 10 samples of size 6 each in the production of a certain product.
Draw control chart for mean and range with its control limits.

Solution:
Example
9.23
You are given below the
values of sample mean ( ![]() ) and the range ( R ) for
ten samples of size 5 each. Draw mean chart and comment on the state of control
of the process.
) and the range ( R ) for
ten samples of size 5 each. Draw mean chart and comment on the state of control
of the process.

Given the following control chart
constraint for : n = 5, A2 = 0.58, D3 = 0 and D4
= 2.115
Solution:
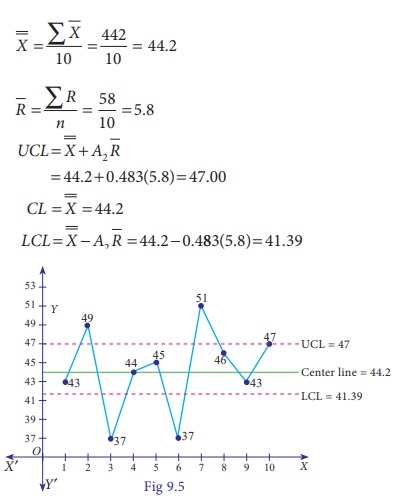
The above diagram shows all the
three control lines with the data points plotted, since four points falls out
of the control limits, we can say that the process is out of control.
Related Topics