Problem Questions with Answer, Solution | Applied Statistics - Exercise 9.3: Statistical Quality Control (SQC) | 12th Business Maths and Statistics : Chapter 9 : Applied Statistics
Chapter: 12th Business Maths and Statistics : Chapter 9 : Applied Statistics
Exercise 9.3: Statistical Quality Control (SQC)
Exercise 9.3
1. Define Statistical Quality Control.
2. Mention the types of causes for
variation in a production process.
3. Define Chance Cause.
4. Define Assignable Cause.
5. What do you mean by product control?
6. What do you mean by process control?
7. Define a control chart.
8. Name the control charts for
variables.
9. Define mean chart.
10. Define R Chart.
11. What are the uses of statistical
quality control?
12. Write the control limits for the
mean chart.
13. Write the control limits for the R
chart.
14. A machine is set to deliver packets
of a given weight. Ten samples of size five each were recorded. Below are given
relevant data:
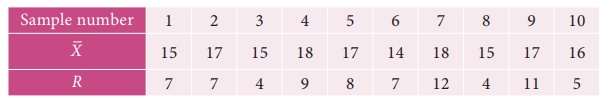
Calculate the control limits for mean
chart and the range chart and then comment on the state of control. (conversion
factors for n = 5, A2 = 0.58 , D3 = 0 and D4 =
2.115 )
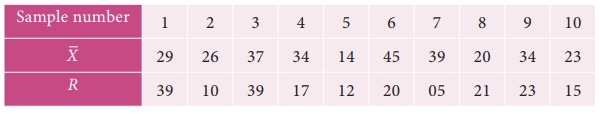
15. Ten samples each of size five are
drawn at regular intervals from a manufacturing process. The sample means ( ![]() ) and their ranges ( R ) are given below:
) and their ranges ( R ) are given below:
Calculate the control limits in respect
of ![]() chart. ( Given A2 = 0.58 , D3 = 0 and D4 = 2.115 )
chart. ( Given A2 = 0.58 , D3 = 0 and D4 = 2.115 )
Comment on the state of control.
16. Construct ![]() and R charts
for the following data:
and R charts
for the following data:
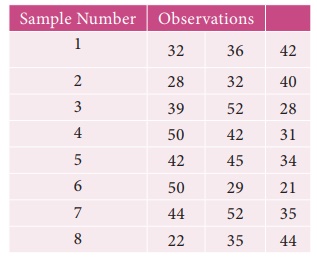
(Given for n = 3, A2 = 0.58 ,
D3 = 0 and D4 = 2.115 )
17. The following data show the values
of sample mean ( ![]() ) and its range ( R ) for the samples of size five
each. Calculate the values for control limits for mean , range chart and
determine whether the process is in control.
) and its range ( R ) for the samples of size five
each. Calculate the values for control limits for mean , range chart and
determine whether the process is in control.
( conversion factors for n = 5, A2
= 0.58 , D3 = 0 and D4 = 2.115 )
18. A quality control inspector has
taken ten samples of size four packets each from a potato chips company.The
contents of the sample are given below, Calculate the control limits for mean
and range chart.
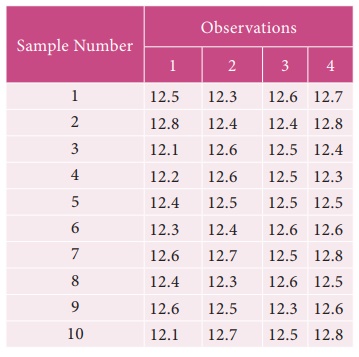
(Given for n = 5, A2 = 0.58 ,
D3 = 0 and D4 = 2.115 )
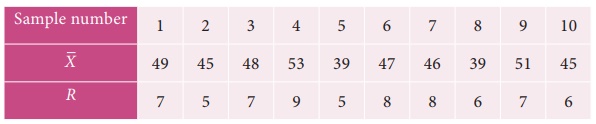
19. The following data show the values
of sample means and the ranges for ten samples of size 4 each. Construct the
control chart for mean and range chart and determine whether the process is in
control.
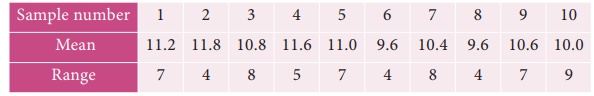
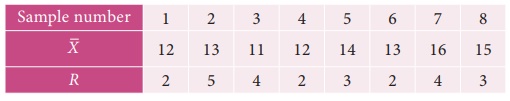
20. In a production process, eight
samples of size 4 are collected and their means and ranges are given below.
Construct mean chart and range chart with control limits.
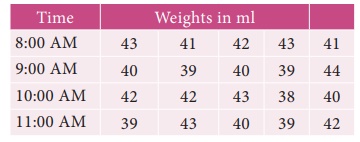
21. In a certain bottling industry the
quality control inspector recorded the weight of each of the 5 bottles selected
at random during each hour of four hours in the morning.
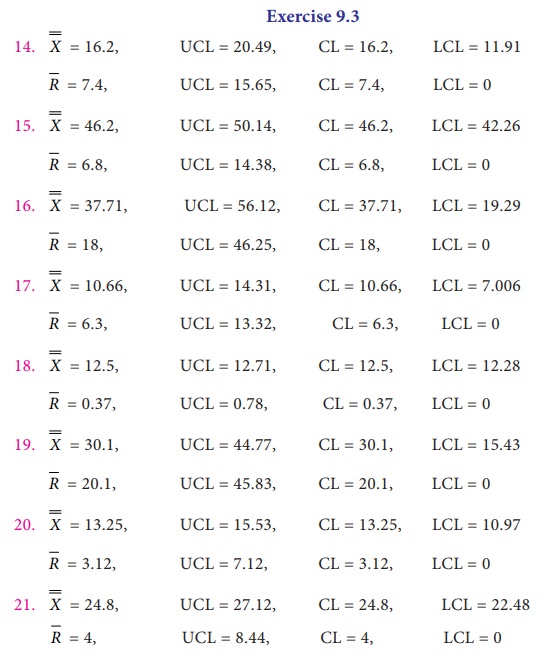
Answers:
Related Topics