Problem Questions with Answer, Solution | Applied Statistics - Exercise 9.1: Time Series Analysis and Measurements of Trends | 12th Business Maths and Statistics : Chapter 9 : Applied Statistics
Chapter: 12th Business Maths and Statistics : Chapter 9 : Applied Statistics
Exercise 9.1: Time Series Analysis and Measurements of Trends
Exercise 9.1
1. Define Time series.
2. What is the need for studying time series?
3. State the uses of time series.
4. Mention the components of the time series.
5. Define secular trend.
6. Write a brief note on seasonal variations
7. Explain cyclic variations
8. Discuss about irregular variation
9. Define seasonal index.
10. Explain the method of fitting a straight line.
11. State the two normal equations used in fitting a straight line.
12. State the different methods of measuring trend.
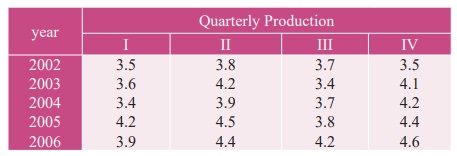
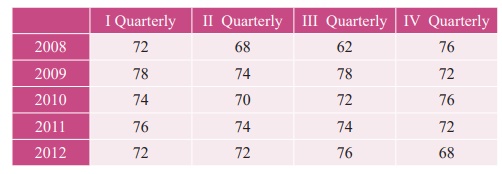
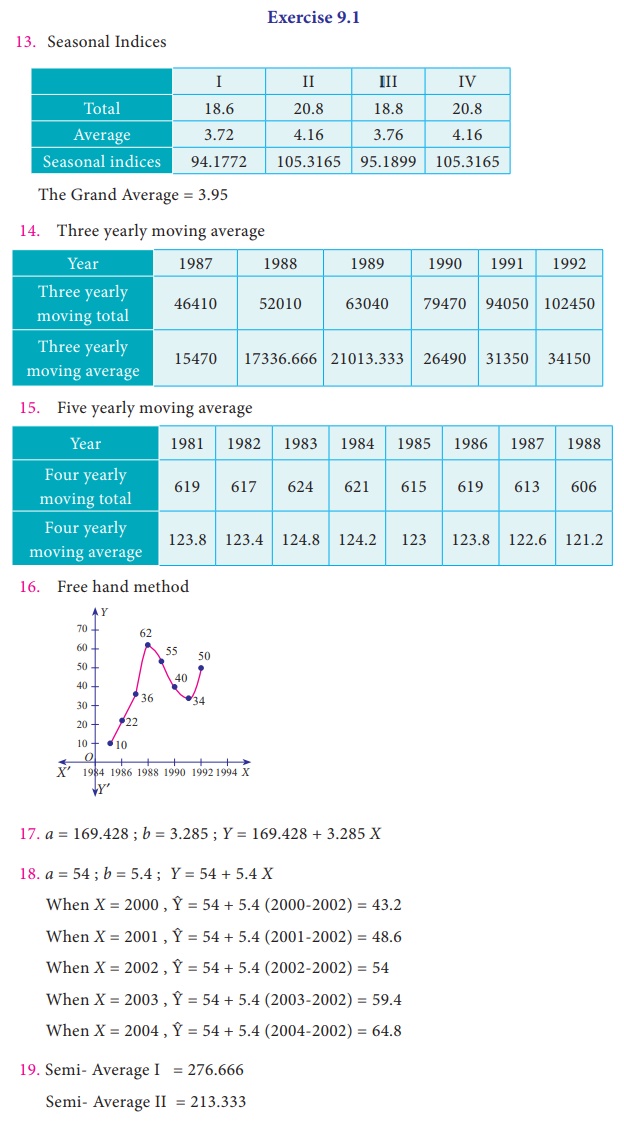
13. Compute the average seasonal movement for the following series
14. The following figures relates to the profits of a commercial concern for 8 years
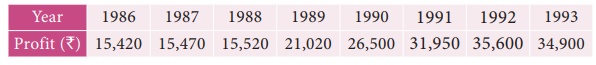
Find the trend of profits by the method of three yearly moving averages.
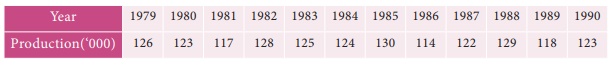
15. Find the trend of production by the method of a five-yearly period of moving average for the following data:
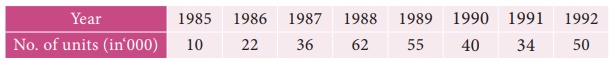
16. The following table gives the number of small-scale units registered with the Directorate of Industries between 1985 and 1991. Show the growth on a trend line by the free hand method.
17. The annual production of a commodity is given as follows :
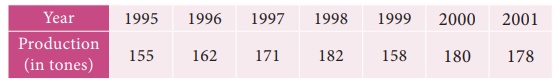
Fit a straight line trend by the method of least squares.
18. Determine the equation of a straight line which best fits the following data
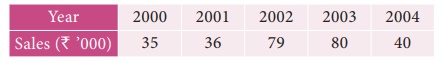
Compute the trend values for all years from 2000 to 2004
19. The sales of a commodity in tones varied from January 2010 to December 2010 as follows:
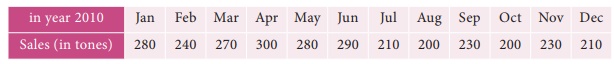
Fit a trend line by the method of semi-average.
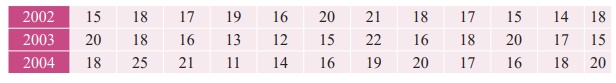
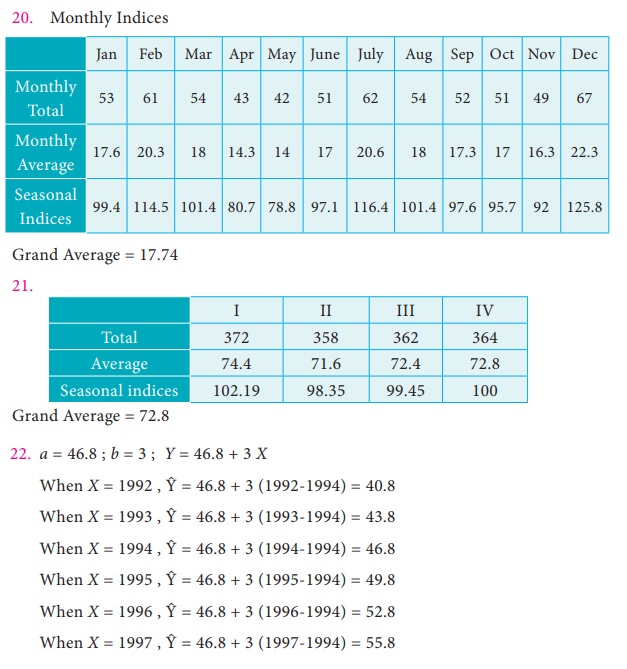
20. Use the method of monthly averages to find the monthly indices for the following data of production of a commodity for the years 2002, 2003 and 2004.
21. Calculate the seasonal indices from the following data using the average from the following data using the average method:
22. The following table shows the number of salesmen working for a certain concern:
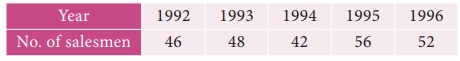
Use the method of least squares to fit a straight line and estimate the number of salesmen in 1997.
Answers:
Related Topics