Procedure, Example Solved Problem | Time Series Analysis - Measurements of Trends: Freehand or Graphic Method | 12th Business Maths and Statistics : Chapter 9 : Applied Statistics
Chapter: 12th Business Maths and Statistics : Chapter 9 : Applied Statistics
Measurements of Trends: Freehand or Graphic Method
Freehand or Graphic Method.
It is the simplest and most flexible method for estimating a trend. We will see the working procedure of this method.
Procedure:
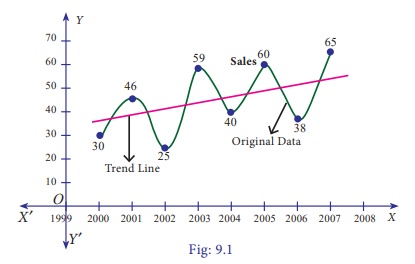
(a) Plot the time series data on a graph.
(b) Draw a freehand smooth curve joining the plotted points.
(c) Examine the direction of the trend based on the plotted points.
(d) Draw a straight line which will pass through the maximum number of plotted points.
Example 9.1
Fit a trend line by the method of freehand method for the given data.
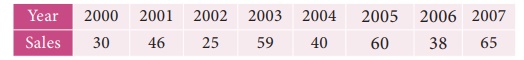
Solution:
Note
The trend drawn by the freehand method can be extended to predict the future values of the given data. However, this method is subjective in nature, predictions obtained by this method depends on the personal bias and judgement of the investigator handling the data.
Related Topics