Statistical Quality Control (SQC) | Applied Statistics - Construction of X and R charts | 12th Business Maths and Statistics : Chapter 9 : Applied Statistics
Chapter: 12th Business Maths and Statistics : Chapter 9 : Applied Statistics
Construction of X and R charts
Applied Statistics : Statistical Quality Control (SQC)
Construction
of ![]() and R charts
and R charts
Any production process
is not perfect enough to produce all the products exactly the same. Some amount
of variation is inherent in any production process. This variation is a total
of number of characteristics of the production process such as raw materials,
machine setting, operators, handling new operations and new machines, etc. The ![]() chart is used to show the quality averages of the samples taken
from the given process. The R chart is used to show the variability or
dispersion of the samples taken from the given process. The control limits of
the
chart is used to show the quality averages of the samples taken
from the given process. The R chart is used to show the variability or
dispersion of the samples taken from the given process. The control limits of
the ![]() and R charts shows the presence or absence of
assignable causes in the production process. Both
and R charts shows the presence or absence of
assignable causes in the production process. Both ![]() and R
charts are usually required for decision making to accept or reject the
process.
and R
charts are usually required for decision making to accept or reject the
process.
The procedure for
constructing ![]() and R charts are outlined below.
and R charts are outlined below.
Procedure for ![]()
(i) Let X1,X2,
X3, etc. be the samples selected, each containing ‘n’
observations (usually n = 4, 5 or 6)
(ii) Calculate mean for
each samples ![]() 1 ,
1 , ![]() 2 ,
2 , ![]() 3 .... by using
3 .... by using
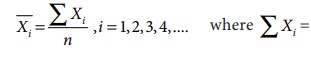 total of ‘n’ values included in the sample Xi .
(iii) Find the mean (![]() )
of the sample means.
)
of the sample means.
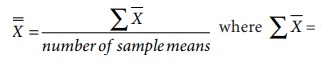 total of all the sample means.
Procedure for R -Charts.
Calculate R
= xmax − xmin
Let R1,
R2, R3… be the ranges of the ‘n’
samples. The average range is given by

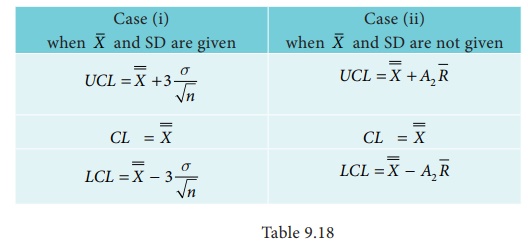
The calculation of
control limits for ![]() chart in two different cases is
chart in two different cases is
The calculation of
control limits for R chart in two different cases are
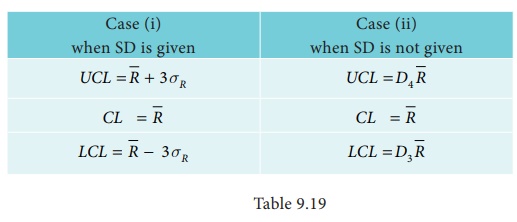
The values of A2,
D3 and D4 are given in the table.
Related Topics