Applied Statistics - Miscellaneous Problems | 12th Business Maths and Statistics : Chapter 9 : Applied Statistics
Chapter: 12th Business Maths and Statistics : Chapter 9 : Applied Statistics
Miscellaneous Problems
Miscellaneous Problems
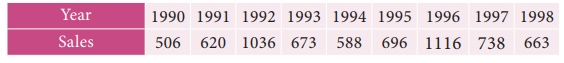
1. Using three yearly moving averages, Determine the trend values from the following data.
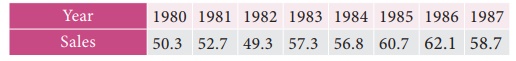
2. From the following data, calculate the trend values using fourly moving averages.
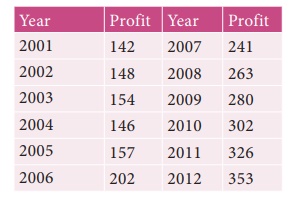
3. Fit a straight line trend by the method of least squares to the following data.
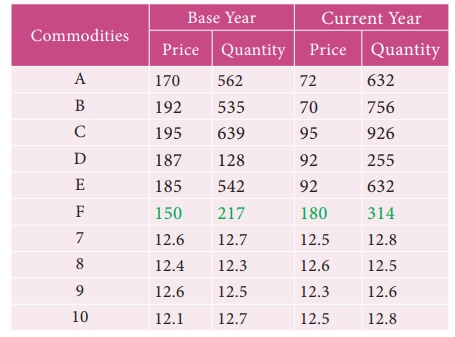
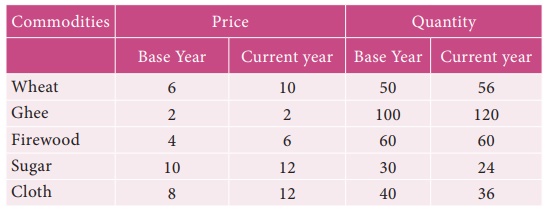
4. Calculate the Laspeyre’s, Paasche’s and Fisher’s price index number for the following data. Interpret on the data.
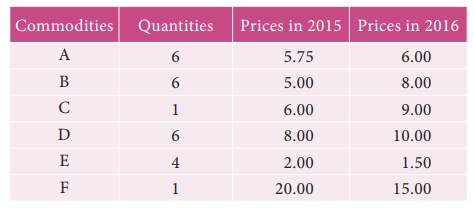
5. Using the following data, construct Fisher’s Ideal Index Number and Show that it satisfies Factor Reversal Test and Time Reversal Test?
6. Compute the consumer price index for 2015 on the basis of 2014 from the following data.
7. An Enquiry was made into the budgets of the middle class families in a city gave the following information.
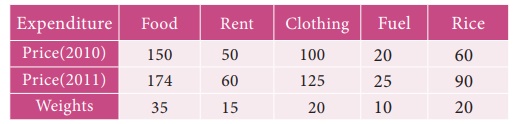
What changes in the cost of living have taken place in the middle class families of a city?
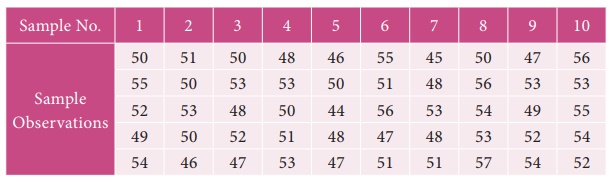
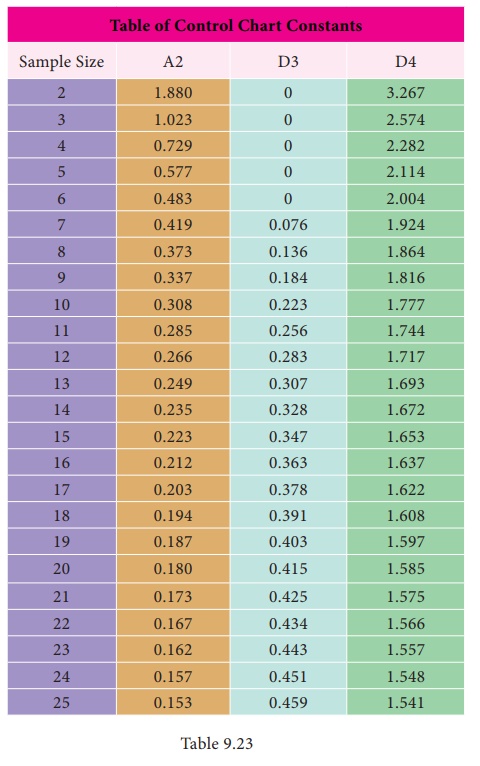
8. From the following data, calculate the control limits for the mean and range chart.
10. The following data gives the average life(in hours) and range of 12 samples of 5lamps each. The data are
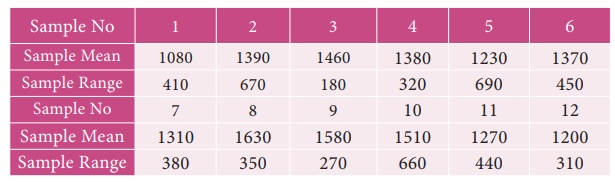
Construct control charts for mean and range. Comment on the control limits.
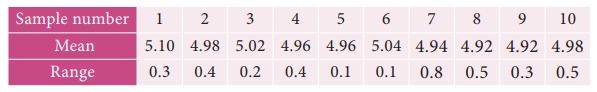
11. The following are the sample means and ranges for 10 samples, each of size 5. Calculate the control limits for the mean chart and range chart and state whether the process is in control or not.
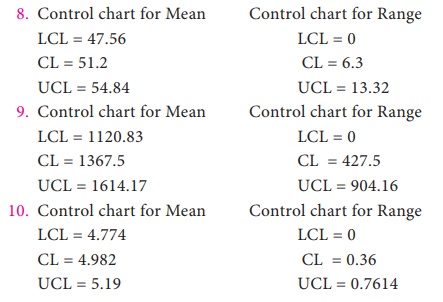
Answers:
1. Three yearly moving Average
148, 149.33, 152.33, 168.33, 253.33, 261.33, 281.67, 302.67, 327.
2. Four yearly moving Average
708.75, 729.25, 748.25, 768.25, 784.5
3. Y = 55.975+ 0.825X
4. L= 49.9 P= 50.32 Fisher’s = 50.09
5. Fisher =139.8
6. Consumer price index = 118.77
7. CLI = 126.10. The cost of living has increased upto 26.10% in 2011 as compared to 2010.
Related Topics