Statistical Quality Control (SQC) | Applied Statistics - Process Control and Product Control | 12th Business Maths and Statistics : Chapter 9 : Applied Statistics
Chapter: 12th Business Maths and Statistics : Chapter 9 : Applied Statistics
Process Control and Product Control
Statistical Quality Control (SQC):
Process
Control and Product Control
The main objective in
any production process is to control and maintain a satisfactory quality level
of the manufactured product. This is done by ‘Process Control’. In Process
Control the proportion of defective items in the production process is to be
minimized and it is achieved through the technique of control charts. Product
Control means that controlling the quality of the product by critical
examination through sampling inspection plans. Product Control aims at a
certain quality level to be guaranteed to the customers. It attempts to ensure
that the product sold does not contain a large number of defective items. Thus
it is concerned with classification of raw materials, semi-finished goods or
finished goods into acceptable or rejectable products.
Control Charts
In an industry, there
are two kinds of problems to be faced, namely
(i) To check whether the
process is conforming to its standard level.
(ii) To improve the
standard level and reduce the variability.
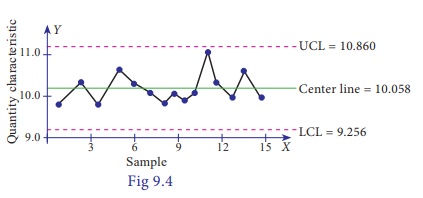
Shewhart’s control
charts provide an answer to both. It is a simple technique used for detecting
patterns of variations in the data. Control charts are simple to construct and
easy to interpret. A typical control charts consists of the following three
lines.
(i) Centre Line (CL)
indicates the desired standard level of the process.
(ii) Upper Control Limit
(UCL) indicates the upper limit of tolerance.
(iii) Lower Control
Limit (LCL) indicates the lower limit of tolerance.
If the data points fall
within the control limits, then we can say that the process is in control,
instead if one or more data points fall outside the control limits, then we can
say that the process is out of control.

For example, the following lines with the data points plotted, diagram shows all the three controlsince all the points falls within the control limits, we can say that the process is in control.
Control Charts for Variables
These charts may be
applied to any quality characteristic that can be measured quantitatively. A
quality characteristic which can be expressed in terms of a numerical value is
called as a variable. Many quality characteristics such as dimensions like
length, width, temperature, tensile strength etc… of a product are measurable
and are expressed in a specific unit of measurements. The variables are of
continuous type and are regarded to follow normal probability law. For quality
control of such data, there are two types of control charts used. They are as
follows :
(i) Charts for
Mean ( ![]() )
)
(ii) Charts for Range
(R)
Related Topics