Procedure, Example Solved Problem | Time Series Analysis - Measurements of Trends: Method of Semi-Averages | 12th Business Maths and Statistics : Chapter 9 : Applied Statistics
Chapter: 12th Business Maths and Statistics : Chapter 9 : Applied Statistics
Measurements of Trends: Method of Semi-Averages
Method of Semi-Averages
In this method, the semi-averages are calculated to find out the trend values. Now, we will see the working procedure of this method.
Procedure:
(i) The data is divided into two equal parts. In case of odd number of data, two equal parts can be made simply by omitting the middle year.
(ii) The average of each part is calculated, thus we get two points.
(iii) Each point is plotted at the mid-point (year) of each half.
(iv) Join the two points by a straight line.
(v) The straight line can be extended on either side.
(vi) This line is the trend line by the methods of semi-averages.
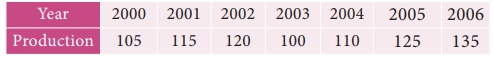
Example 9.2
Fit a trend line by the method of semi-averages for the given data.
Solution:
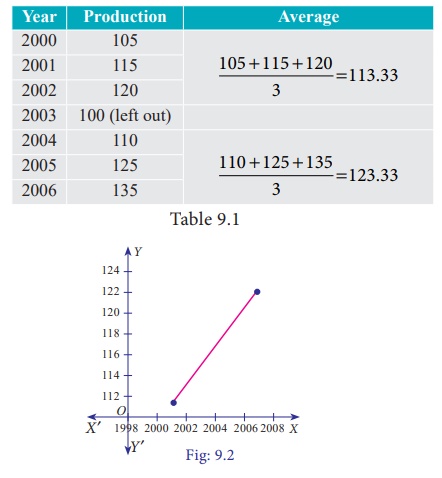
Since the number of years is odd(seven), we will leave the middle year’s production value and obtain the averages of first three years and last three years.
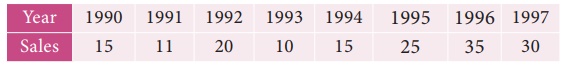
Example 9.3
Fit a trend line by the method of semi-averages for the given data.
Solution:
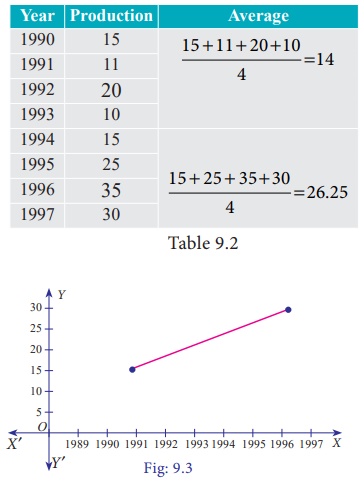
Since the number of years is even(eight), we can equally divide the given data it two equal parts and obtain the averages of first four years and last four years.
Note
(i) The future values can be predicted.
(ii) The trend values obtained by this method and the predicted values are not precise.
Related Topics