Chapter: Mechanical : Total Quality Management (TQM) : TQM Tools & Techniques
Quality costs

QUALITY COSTS
QUALITY COSTS:-
Quality costs are defined as those costs associated with the non-achievement of prodect/service quality as defined by the requirements established by the organization and its contracts with customers and society.
├ś Quality cost is a cost for poor product of service.
ELEMENTS OF QUALITYCOST:-
├╝ Cost of prevention
├╝ Cost of appraisal
├╝ Cost of internal failures
├╝ Cost of external failures.
ANALYSIS OF QUALITY COSTS:-
├╝ Trend analysis
├╝ Pareto analysis
1 PREVENTION COST
├ś Marketing / Customer / User.
├ś Product / Service / Design Development.
├ś Purchasing
├ś Operations (Manufacturing or Service)
├ś Quality Administration.
2. APPRAISAL COST
├ś Purchasing Appraisal Costs.
├ś Operations Appraisal Costs
├ś External Appraisal Costs
├ś Review of Test and Inspection Data
├ś Miscellaneous Quality Evaluations
3. INTERNAL FAILURE COST
├ś Product or Service Design Failure Costs (Internal)
├ś Purchasing Failure Costs
├ś Operations (Product or Service) Failure Costs
4.EXTERNAL FAILURE COST
├ś Complaint Investigations of Customer or User Service
├ś Returned Goods
├ś Retrofit and Recall Costs
├ś Warranty Claims
├ś Liability Costs
├ś Penalties
├ś Customer or User Goodwill
├ś Lost Sales
ANALYSIS TECHNIQUES OF QUALITY COST
├ś The purpose of quality cost analysis is to determine the cost of maintaining a certain level of quality.
├ś Such activity is necessary to provide feedback to management on the performance of quality assurance and to assist management in identifying opportunities.
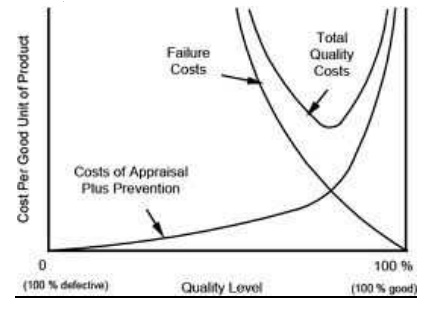
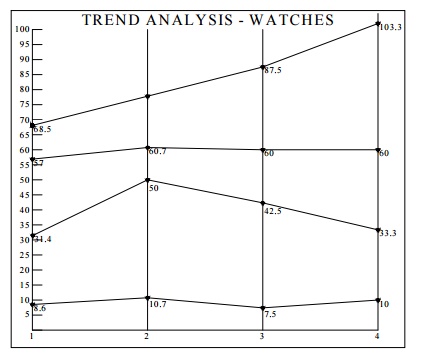
TREND ANALYSIS :
├ś Good visual aids are important communication tools.
├ś Graphs are particularly useful in presenting comparative results to management.
Trend Analysis is one where Time-to-Time comparisons can be made which illustrates the changes in cost over time.
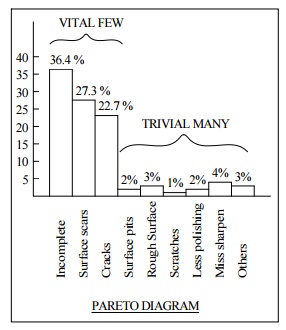
PARETO ANALYSIS :
├ś Joseph Juran observed that most of the quality problems are generally created by only a few causes.
├ś For example, 80% of all internal failures are due to one (or) two manufacturing problems.
Identifying these ŌĆ£vital fewŌĆØ and ignoring the ŌĆ£trivial manyŌĆØ will make the corrective action give a high return for a low money input.
INDEX NUMBERS :
Index Numbers are often used in a variety of applications to measure prices, costs (or) other numerical quantities and to aid managers in understanding how conditions in one period compare with those in other periods.
A simple type of index is called a RELATIVE INDEX.
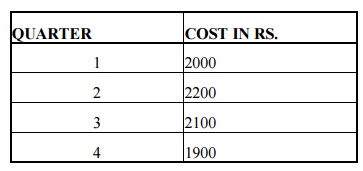
QUARTER COST IN RS.
1 2000
2 2200
3 2100
4 1900
Cost Index in quarter t = (Cost in quarter t / Base period cost) x 100
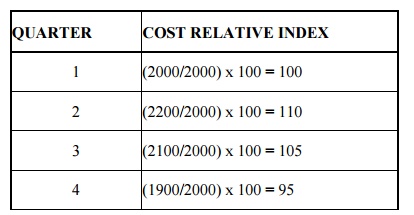
QUARTER COST RELATIVE INDEX
1 (2000/2000) x 100 = 100
2 (2200/2000) x 100 = 110
3 (2100/2000) x 100 = 105
4 (1900/2000) x 100 = 95
PERFORMANCE MEASURES
Performance measures are required for the managers for managing an organization perfectly.
Performance measures are used to achieve the following objectives.
├ś To establish performance measures and reveal trend.
├ś To identify the processes to be improved.
├ś To determine the process gains and losses.
├ś To compare the actual performance with standard performance.
├ś To provide information for individual and team evaluation.
├ś To determine overall performance of the organization.
├ś To provide information for making proper decisions.
WHAT SHOULD BE MEASURED?
1 Human resources
1. Lost time due to accidents, absenteeism.
2. Employee turnover.
3. Employee satisfaction index.
4. Training cost per employee.
5. Number of grievances.
2 Customers
1. Number of complaints from customers.
2. Number of on-time deliveries.
3. Warranty data.
4. Dealer satisfaction.
3 Production
2. Inventory.
3. SPC Charts.
4. Amount of scrap / rework.
5. Machine down time.
4 Research and Development
2. New product time to market.
3. Design change orders.
4. Cost estimating errors.
5 Suppliers
2. On-time delivery.
3. Service rating.
4. Quality performance.
5. Average lead time.
6 Marketing / Sales
1. Sales expense to revenue.
2. New product sales to total sales.
3. New customers.
7 Administration
1. Revenue per employee.
2. Purchase order error.
3. Billing accuracy.
4. Cost of poor quality.
STRATEGY :
The quality council has the overall responsibility for the performance measures.It ensures that all the measures are integrated into a total system of measures.
A typical system contains the following function
├ś Quality
├ś Cost
├ś Flexibility
├ś Reliability
├ś Innovation
PERFORMANCE MEASURE PRESENTATION :
There are six basic techniques for presenting performance measures. They are
1. Time series graph.
2. Control charts.
3. Capability Index.
4. TaguchiŌĆÖs loss function.
5. Cost of poor quality.
6. Malcolm Baldrige National Quality Award.
In MBNQA, five categories are analyzed. They are
a) Manufacturing
b) Service
c) Small business
d) Health care
e) Education
During the 1950ŌĆŚs the concept of
ŌĆĢQuality CostŌĆ¢emerged.
Different people assigned different meanings to the
term. Some people equated quality
cost with the cost of attaining quality; some people equated the term with the
extra incurred due to poor quality. But, the widely
accepted thing is ŌĆĢQuality cost is the extra cost incurred due to poor or bad
quality of the product or service.
Categories of Quality Cost :
Many companies summarize quality
costs into four broad categories. They are, a) Internal failure costs - The
cost associated with defects that are found prior to transfer of the product to
the customer. b) External failure costs - The cost associated with defects that
are found after product is shipped to the customer. c) Appraisal costs - The
cost incurred in determining the degree of conformance to quality requirement.
d) Prevention costs - The cost incurred in keeping failure and appraisal costs
to a minimum.
Analysis technique for Quality Cost
The term "trend analysis"
refers to the concept of collecting information and attempting to spot a
pattern, or trend, in the information. In some fields of study, the term
"trend analysis" has more formally-defined meanings. Although trend
analysis is often used to predict future events, it could be used to estimate uncertain
events in the past, such as how many ancient kings probably ruled between two
dates, based on data such as the average years which other known kings reigned.
4) Explain
Pareto Analysis
This fact gave rise to the Pareto effect or ParetoŌĆŚs
law: ŌĆō ŌĆŚthe vital few and the
trivial manyŌĆŚ.
The Pareto effect is named after Vilfredo Pareto, an economist and sociologist
who
lived from 1848 to 1923. Originally trained as an engineer he was a one time
managing director of a group of coalmines.
Pareto analysis is a
statistical technique in decision making that is used for selection of a limited
number of tasks that produce significant overall effect. It uses the Pareto
principle - the idea that by doing 20% of work you can generate 80% of the
advantage of doing the entire job. Or in terms of quality improvement, a large
majority of problems (80%) are produced by a few key causes (20%).
Pareto analysis is a formal
technique useful where many possible courses of action are competing for your
attention. In essence, the problem-solver estimates the benefit delivered by
each action, then selects a number of the most effective actions that deliver a
total benefit reasonably close to the maximal possible one. Use of Pareto
principle in prioritizing or ranking a range of items which have different
levels of significance. Its objective is to separate the 'vital few' from the
'useful many.'
Related Topics